In an October 11, 2013 article titled “World’s first mapping of America’s rare plants,” Peter Christensen and Christina Troelsen, writing for Aarhus University, state: “The results of a major international research project show that climate stability plays a crucial role in the distribution of plants on Earth. Rare species in the Americas are restricted to areas of California, Mexico, the Caribbean islands, parts of the Andes mountains, the south of South America, and the region around Rio de Janeiro. The flora in most of North America and the Amazon basin, however, are dominated by widespread species.
In collaboration with international colleagues, a research group at Aarhus University has contributed to the compilation of the most comprehensive botanical data set to date. PhD student Naia Morueta-Holme and her supervisor, Professor Jens-Christian Svenning, Department of Bioscience, spearheaded the analysis that reveals where rare species are found in the New World (North and South America) and the factors that determine whether a region is dominated by widespread or rare species.
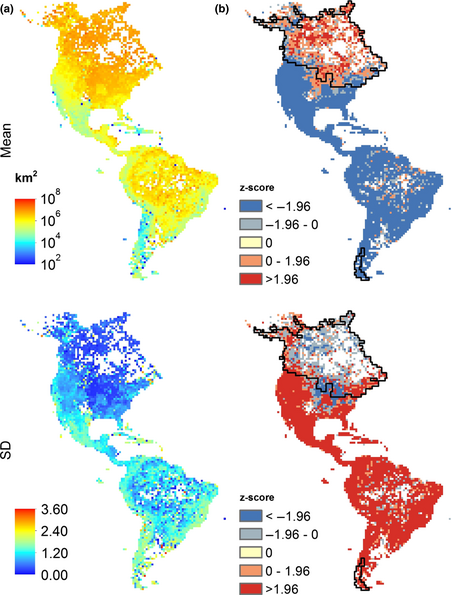
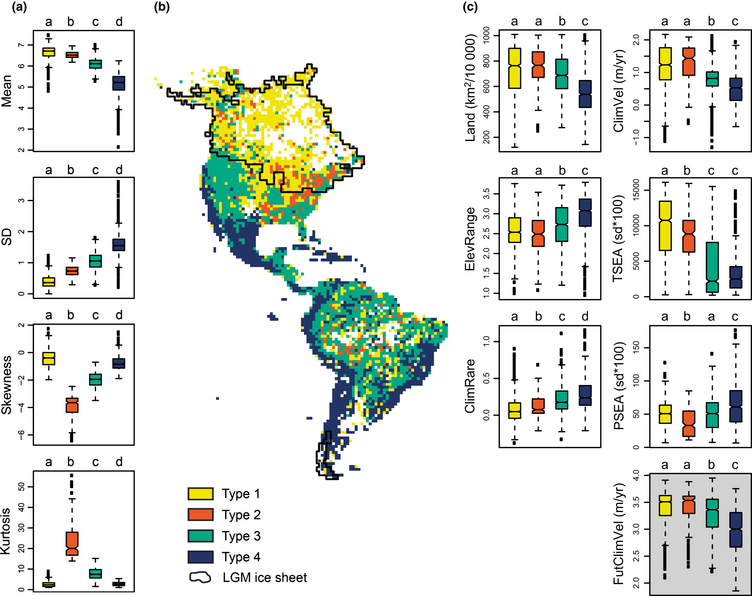
“The study shows that especially California, Mexico, the Caribbean islands, parts of the Andes, the south of South America, and the region around Rio de Janeiro are dominated by rare species. This came as a surprise to us, because the regions are very different in terms of climate and vegetation type. They include habitats such as wet tropical rainforests, dry subtropical regions, and even deserts, tropical mountains, and cool temperate grasslands and forests,” says Professor Svenning.
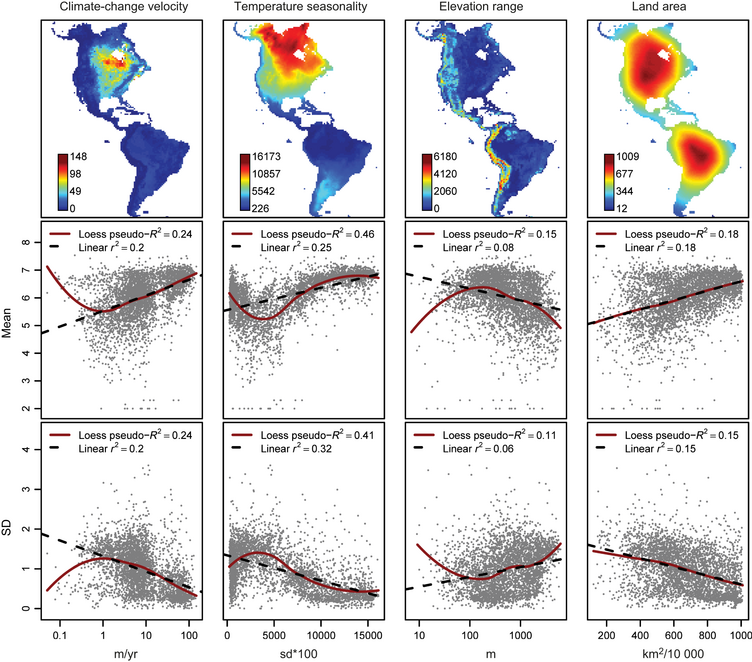
However, the studies show that consistent processes are driving the distribution of the plants. “There are two factors in particular that are important for the distribution of the rare species. Firstly, a stable climate with relatively small seasonal differences, where the climate has remained much the same for tens of thousands of years. Secondly, only small areas of habitat are involved. The species are unable to spread, but the stability nevertheless enables them to survive for long periods of time, and to develop and specialise in the same place,” explains Naia Morueta-Holme.
In large areas in the north of North America, on the other hand, the seasons vary significantly, and there have been distinct climate changes between ice ages (glacials) and warm ages (interglacials). Widespread species are dominant here, either because they can withstand a wide range of climate conditions or because they are good at dispersing and can track changes in climate over time. They can thus spread over the large habitat areas available.
In terms of the dominance of rare species, the close link between the size of the habitat area and a stable climate is of great concern regarding the impact of human-induced climate changes now prevailing in these regions. “Even though we’re expecting less climate change in the areas dominated by rare species than in North America, for example, it could well be that future changes may be beyond what the species can tolerate. Our results show that climate change will no doubt have serious consequences for some of the most biodiverse areas in the world, which are also threatened by increasing land-use changes of natural areas,” says Naia Morueta-Holme.
The group responsible for the project is called the Botanical Information and Ecology Network (BIEN). After more than five years of work, they have reached their goal: to provide the world’s largest data set to date of all the plants in the New World. Right now, the database contains more than 20 million records of approximately 250,000 species, and more are being added. This study is the first to be published by the project.
“We’ve finally got a place where we can gather all the records and create an overview of where New World plant species are located. This unique data set provides us with an opportunity to fundamentally understand what determines the current diversity and distribution of plants. We’re now better able to predict how species, vegetation and even agricultural crops will react to environmental change. This improves our chances of taking the necessary management measures to avoid negative consequences,” explains Naia Morueta-Holme. The study entitled “Habitat area and climate stability determine geographical variation in plant species range sizes” was published in Ecology Letters, which is the highest-ranked journal for publishing results within ecology research.”