In its introduction to POI Pulse, Geography’s Spatio-Temporal Knowledge Observatory, run by Krzysztof Janowicz, explains that “POI (Point of Interest) Pulse is an interactive application that shows the pulse of user behavior in the Greater Los Angeles area. Visualized through the interaction with approximately 170,000 points of interest (e.g., Bars, Hospitals, Parks) and 12 million tiles, the map displays both typical activities patterns in the region as well as real-time social behavior.”
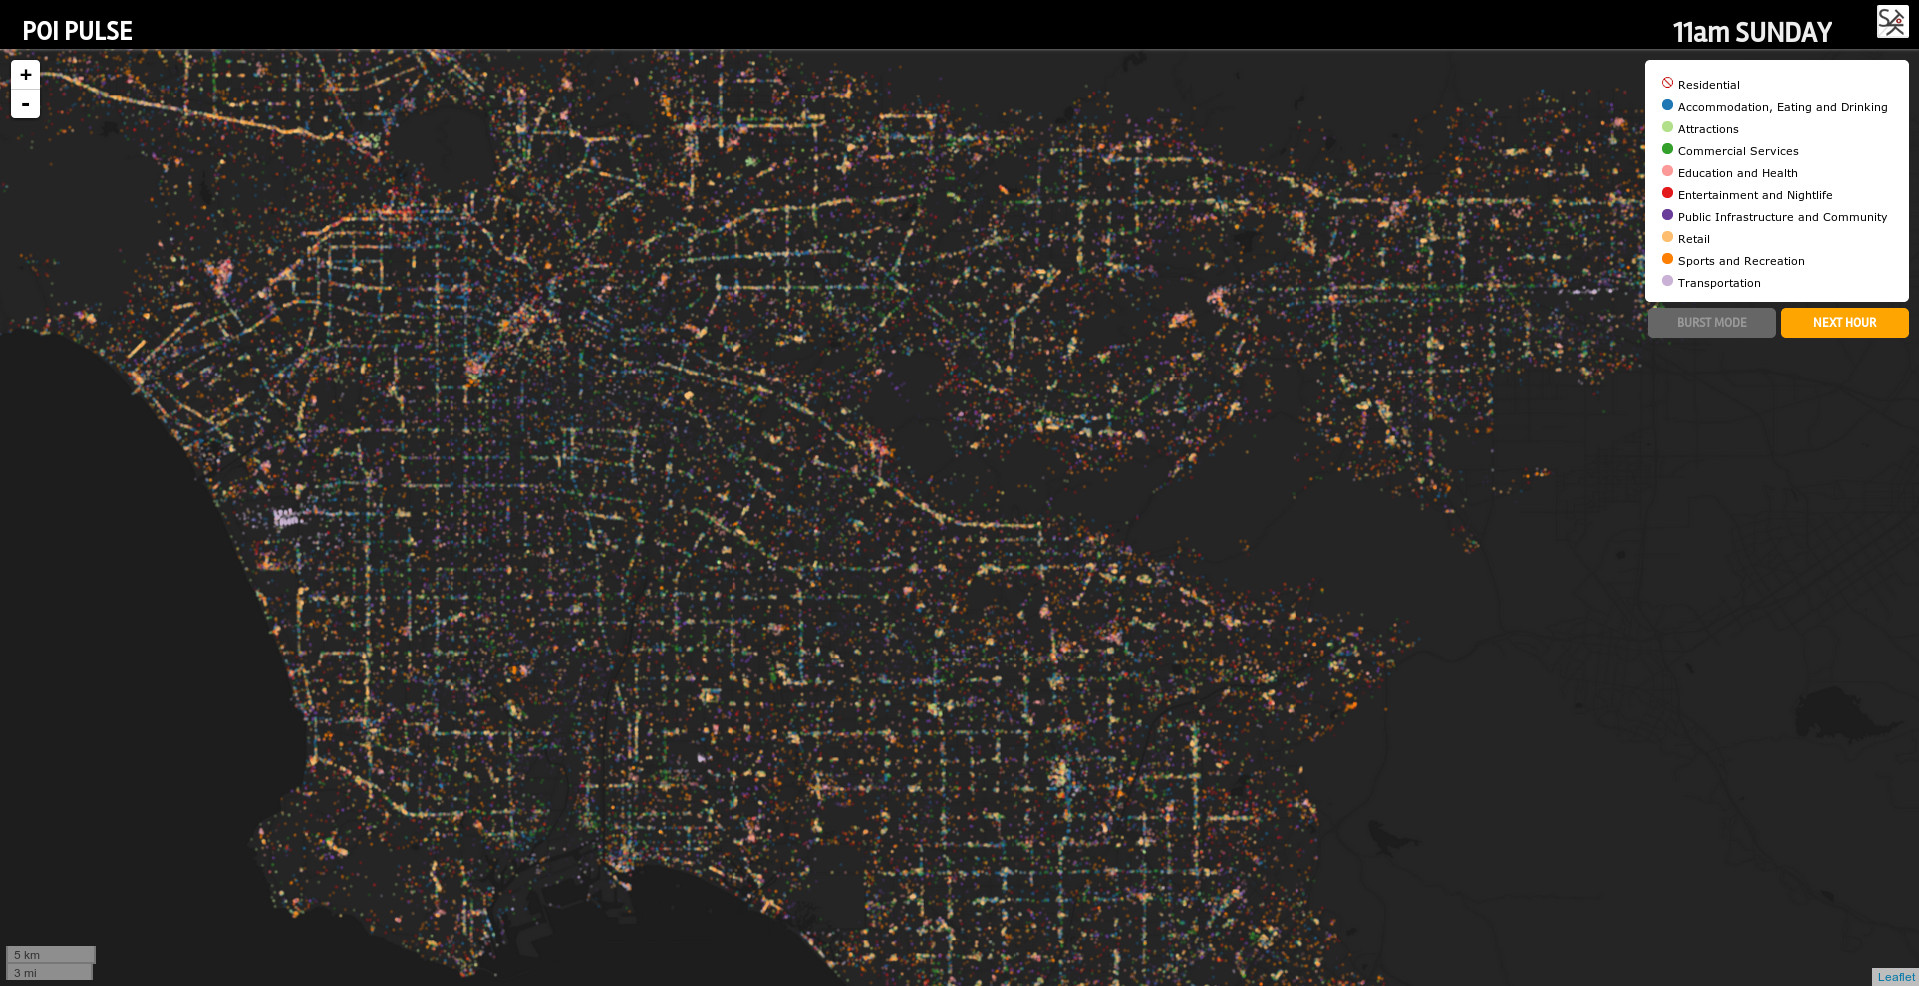
It goes on to say, “After closing this dialog, you will be presented with a map of the Greater Los Angeles area showing all POI styled with white markers. The opacity of the markers indicates the typical level of activity that occurs at this type of POI at the stated time of the day/week. Advancing through time (NEXT HOUR) gives a good introduction to the flow of the city as a whole.
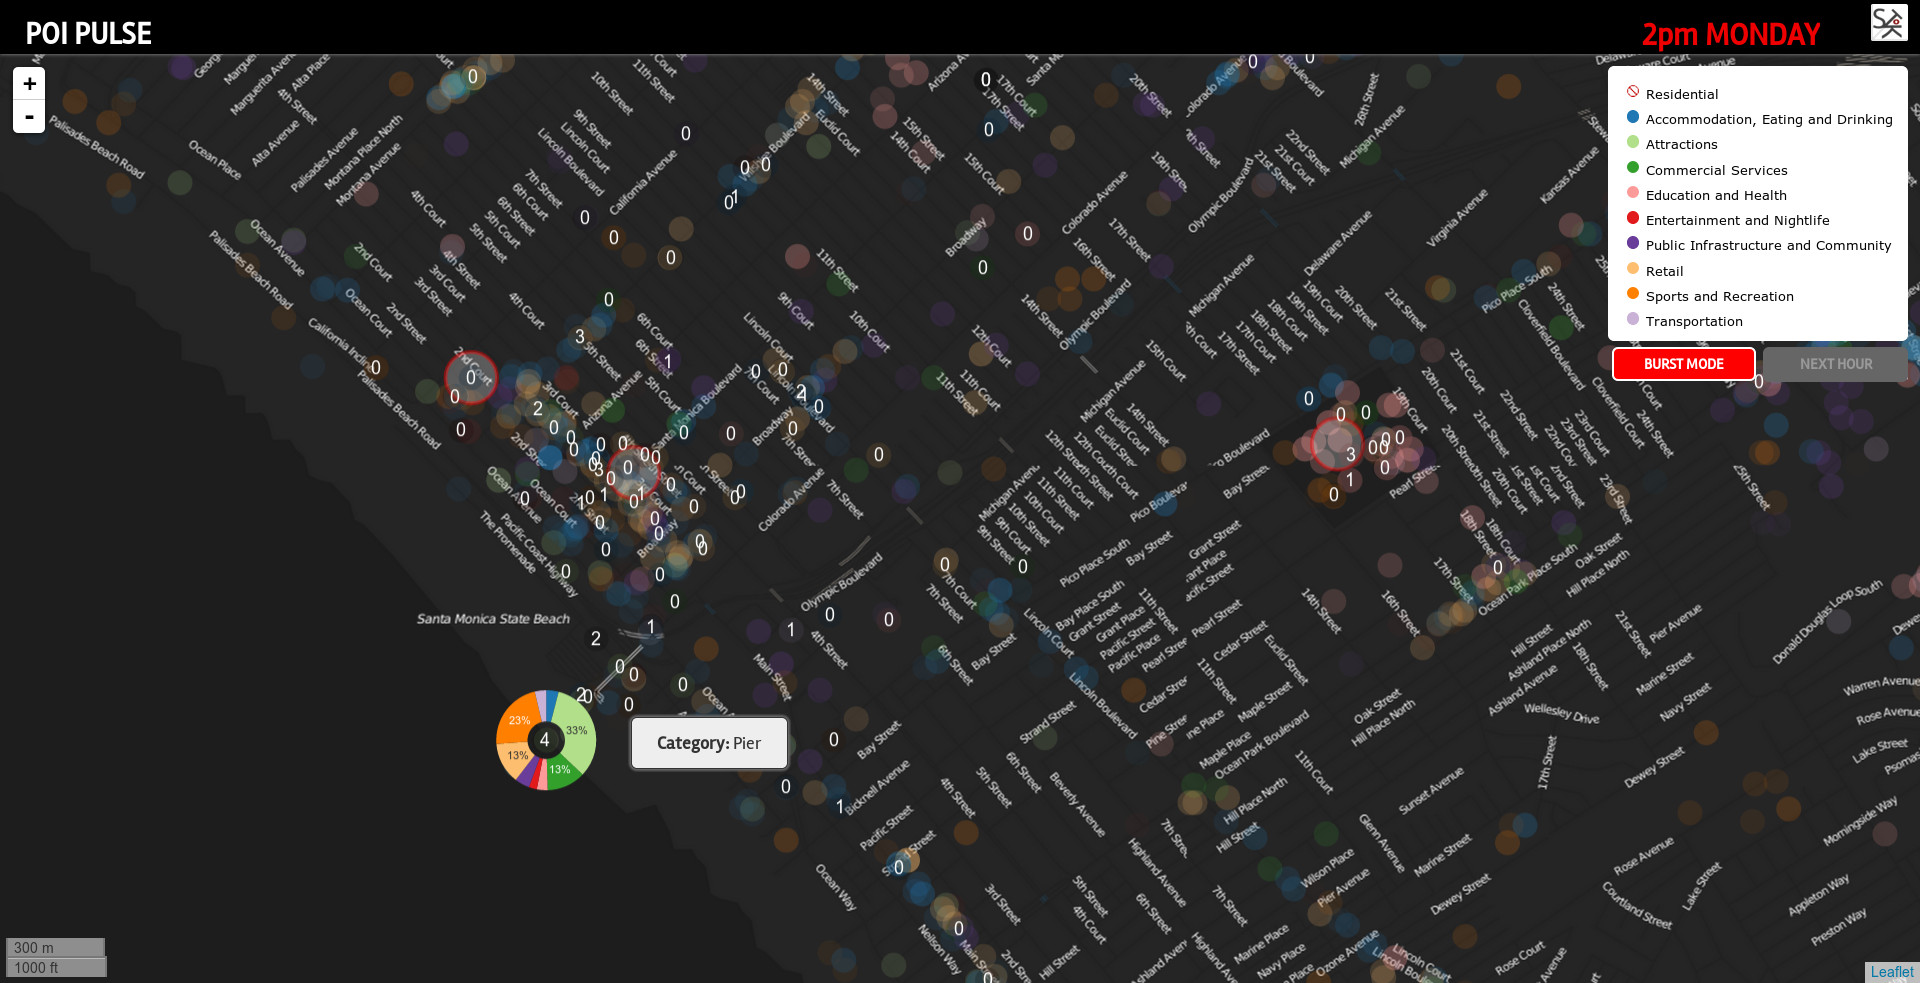
Zooming in, the POI are split in to ten colored categories. The opacity of the markers at this level shows the difference in activity between categories. For example, the category of Entertainment and Nightlife is very prominent on Saturday night while it is completely overshadowed by Commercial Services on Monday at 9am. Zooming in even further, the data format switches from image to vector tiles. Hovering your mouse over any POI at this level displays the category as well as a donut chart surrounding the marker. This donut chart is a technique employed to visually explain the category probabilities of each POI. The standard visualization forces each POI to be assigned a single color representing a single category, but in actuality, the POI may exhibit high probabilities in more than one category.
Lastly, clicking the BURST MODE button (enabled at a high zoom level) shows real-time Tweets. Additionally, the current check-in counts are requested for all Foursquare venues that can be matched to our POI set.”
The text below is from a recent paper on which members of the STKO Lab have been working (McKenzie, G., Janowicz, K., Gao, S., Yang, J-A., Hu, Y., (2014: Under Review). “POI Pulse: A Multi-Granular, Semantic Signatures-Based Approach for the Interactive Visualization of Big Geosocial Data”):
“The age of Big Data promises to offer access to a plethora of data at a spatial, temporal, and thematic resolution unthinkable just a few years ago. This data revolution is accompanied by the emerging 4th paradigm of science in which synthesis is the new analysis. Those changed realities cast off visions of information observatories in which complex systems, such as urban spaces, could be observed and better understood based on exploiting the variety, volume, and velocity of Big Data. Those, however, who tried to explore these new possibilities often encountered equally big challenges. First, major parts of Big Data still reside in closed proprietary silos with limited API access. Second, the metadata, e.g., provenance, and conceptual schemata required for any serious use by scholars are often not present, intransparent, or differ substantially to those established in science. Finally, the sheer volume and velocity makes interacting with or even just visualizing the data difficult to say the least. For many of us, an information observatory for urban spaces in which user- generated real-time content reveals spatial, temporal, and thematic patterns and traits of human behavior, is a tempting idea as it aligns well with the Digital Earth vision. Consequently, a posting on Foursquare’s infographics blog [by grad student Grant McKenzie] in October 2013 raised a lot of attention. It linked to a series of videos showing the pulse of different cities such as San Francisco. The animations were entirely derived from mining massive amounts of user check-ins to the Foursquare Location-based Social Network and were aggregated to a single virtual day; see Figure 1a.
While the visualization itself is absolutely stunning, the Foursquare videos have several shortcomings:
- The videos are not interactive, e.g., one cannot click at any of check- in events or places to gain additional insights.
- The videos are rendered based on a fixed geographic scale and focused on a particular part of the city. Thus, one cannot pan or zoom.
- The millions of check-ins are aggregated to a single non-specific day, thus hiding well known patterns, e.g., weekdays versus weekends.
- Foursquare’s POI taxonomy consists of more than 400 POI types grouped into 9 top-level classes (see Figure 1a). While such generalized classes are necessary and useful, it is not clear how they were derived, nor why certain POI types are categorized in specific ways. Furthermore, a binary class membership on such a coarse level will necessarily introduce arbitrary decisions and thus will significantly alter the observed temporal pulse of the city. For instance, Cemeteries are categorized under the Great Outdoors category.
- Similar to other UGC, Foursquare contains data of widely varying quality. For instance, users often type their own houses as Castle or check-in to features of the types Road, Trail, or Taxi. While this is a consequence of UGC, it is important to clean the data.
Inspired by Foursquare’s pulse videos and the theoretical and technical limitations of interacting and visualizing Big Data, we decided to address the aforementioned restrictions by designing a POI Pulse portal for Los Angeles; 4 see Figure 1b. Naturally, as scientists we are more interested in those theoretical and technical aspects than the application as such, but we will use it as the joint leitmotiv that connects the following research questions which make up the scientific contribution of this work” (read the rest here).
.jpg)
.jpg)