A “controversial study” reported in this recent Journal of Commerce story had antecedents in the Department of Geography. Mike Goodchild and Rick Church were PIs on the USDOT-funded METRIS project, which tracked trucks serving the ports of Los Angeles and Long Beach. Val Noronha, an enigmatic individual sometimes seen around the department, conceptualized METRIS, and was the man at the center of the controversy. I spoke to him to find out more.
How exactly are you associated with the department?
We’re associates. And friends. I’ve been physically within the department in the past, represented UCSB in numerous activities, put together two multi-university consortia and other funded projects, and dealt with offices on campus on a first-name basis. But in formal terms I’m an outsider. I like to get into problems in ways that tend to lie outside the academic domain.
What is METRIS?
METRIS is a metropolitan transportation information system. It’s a vision in which we get real time data on everything that moves in a city. It feeds operations, security and long-term planning decisions. Much of the thinking in intelligent transportation systems (ITS) probably envisages something like this, but for the most part it’s been talked about rather than done.
Tell us a little about the port project
The ports in LA are enormous: 12 container terminals moving 40% of our overseas trade. Half of that is drayed off the ports by trucks. The trucks would like to get in and out of a terminal in about an hour. Usually they do it in under two hours, but it’s often longer, and odd cases, which can be as often as weekly for any given driver, can take 3 hours and more. The trucking companies—licensed motor carriers (LMCs)—and the marine terminal operators (MTOs) have historically quarreled over how long it takes and what needs to be done about it. The data have been anecdotal. Drivers have been accused of entertaining themselves in Long Beach while they blame the MTO for a long delay.
A delay is more than hard luck for a driver. A hundred trucks waiting in line represent $10m worth of infrastructure lying idle. There’s fuel wastage, emissions, air quality concerns, health impacts—local residents get upset about all of this, and they block port expansion projects. Those are serious ramifications. And each delayed container is $140,000 worth of goods lying on a pier instead of on store shelves. So, whether you talk to truckers, terminals, ports, unions, or politicians, this is the #1 concern.
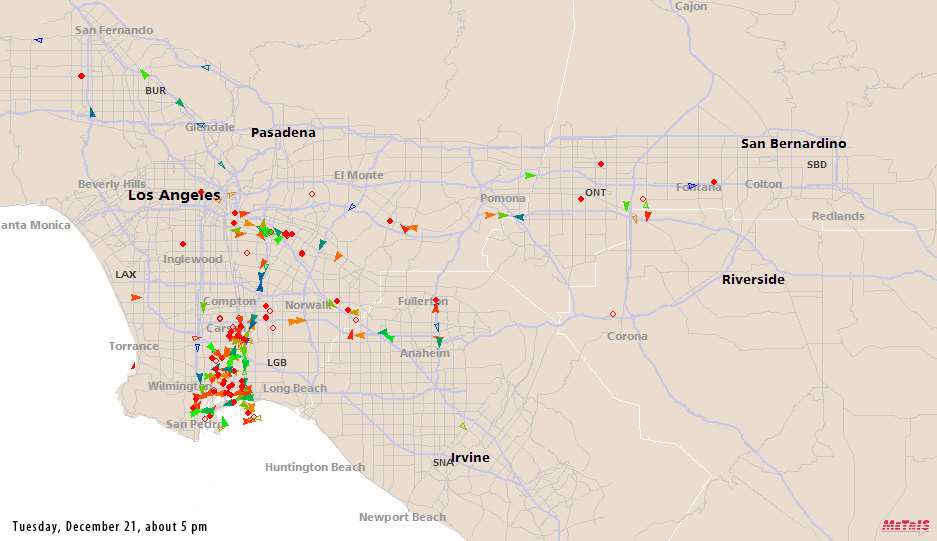
I’d outfitted about 250 of these trucks with specially configured GPS trackers. I measured what they call “turn time,” the time it takes to wait in line and conduct a transaction at a terminal. It was a hit. There were legal shots across my bow from the MTO side and I had to tread carefully. But last summer there was a stunning breakthrough. The LMCs and MTOs got together in a stakeholders group. They hired me to study the turn time problem with objective METRIS data. I was delighted, because it established the commercial credentials of METRIS as a performance monitor of the transportation system, not just another vehicle tracking system.
The findings were partly about the wait numbers. But it had to be more than just settling an argument over who was right and wrong. I looked at reliability and capacity. I found that there’s plenty of capacity in the ports when they’re fully staffed—they can handle a 20% traffic surge quite easily. But the longshore labor breaks need to be better managed to keep the capacity up during the day. They need to re-examine their all-or-nothing congestion fee that make trucks bunch up in the evenings when the fee comes off. So the findings and recommendations were mostly about policy, and it was remarkable how all of that wisdom came out of GPS boxes.
Why was this controversial?
The ports are a complex set of business operations that move half a trillion worth of goods. Small margins multiply out to big numbers, and conflicts among the parties can get fierce. There are divisions within, as well as among industry segments. This study brought some agreement, but it didn’t end every disagreement. Some parties on each side did look to the report to back up their historic case against the other side. I didn’t like it, but it’s not surprising, it has to work itself out. I expect the very same parties to participate in the epilogue, seeing the bigger opportunities and moving forward.
What was the most challenging part of the job?
I wrote some nifty algorithms and came up with interesting new data types. Terminal queues run in pretty tight curves, just as you snake around in security lines at an airport. Trucks are stationary or plodding along slowly, so GPS positional error is quite severe. And trucks don’t always follow a single queue. They get fed up waiting for one approach, take a U-turn and jump into another, maybe off a different street. There are waiting areas where they may just mill around, maybe grab a bite. Geometrically, with all the uncertainties, it ranked up there with the most difficult jobs I’ve ever done. That was satisfying.
The politics were tough too. To me, this is the real challenge in professional geography. It’s one thing to come up with a technical solution to something. But if it’s to make a difference to the real world, people have to identify with it, pay for it, and adopt it. You have to get the cost factors and the human factors right. I’m not fond of politics, but on this project it’s a big part of my sense of accomplishment: having had the parties concur. Until just a few years ago, the ports of LA and Long Beach didn’t communicate with each other. Getting parties to agree on anything in ports this size is a big deal.
Where does METRIS go from here?
First, I’d like to see the recommendations implemented and to monitor the changes in performance. Next, there are operational models that were developed at UCSB and the University of Washington that can deliver significant efficiencies, speeding up operations inside the port and reducing the number of trips throughout the LA basin. And I’m looking at expanding this to other ports.
Will you still be associated with the department?
Always.
That same JOC article concludes: “Despite the difference of opinions expressed by terminal operators and harbor truckers, the port community considers the turn-time study to be a valuable tool for improving gate velocity at the nation’s largest port complex.”