The following is a UCSB Press Release dated May 17, 2011:
“Scientists at UC Santa Barbara have developed new methods for studying how environmental factors and climate affect giant kelp forest ecosystems at unprecedented spatial and temporal scales. The scientists merged data collected underwater by UCSB divers with satellite images of giant kelp canopies taken by the Landsat 5 Thematic Mapper. The findings are published in the feature article of the May 16 issue of Marine Ecology Progress Series (Cavanaugh, K. C., Siegel, D. A., Reed, D. C., and Dennison, P. E. [2011], Environmental controls of giant-kelp biomass in the Santa Barbara Channel, California, MEPS 429:1-17).
In this marriage of marine ecology and satellite mapping, the team of UCSB scientists tracked the dynamics of giant kelp –– the world’s largest alga –– throughout the entire Santa Barbara Channel at approximately six-week intervals over a period of 25 years, from 1984 through 2009. David Siegel, co-author, professor of geography and co-director of UCSB’s Earth Research Institute, noted that having 25 years of imagery from the same satellite is unprecedented. ‘I’ve been heavily involved in the satellite game, and a satellite mission that goes on for more than 10 years is rare. One that continues for more than 25 years is a miracle,’ said Siegel. Landsat 5 was originally planned to be in use for only three years.
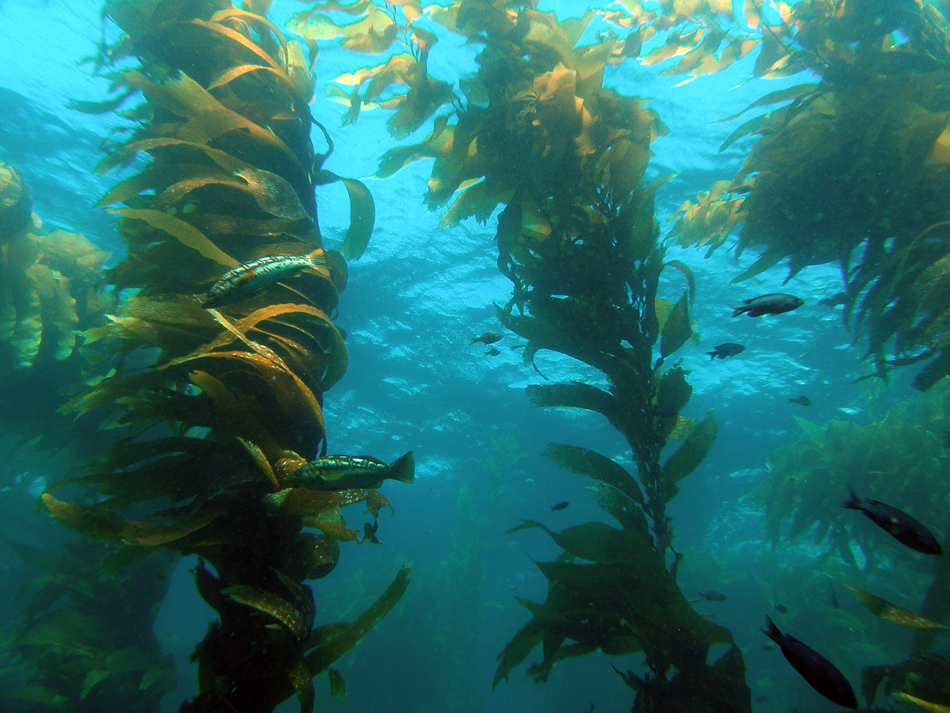
Forests of giant kelp are located in temperate coastal regions throughout the world. They are among the most productive ecosystems on Earth, and giant kelp itself provides food and habitat for numerous ecologically and economically important near-shore marine species. Giant kelp also provides an important source of food for many terrestrial and deep-sea species, as kelp that is ripped from the seafloor commonly washes up on beaches or is transported offshore into deeper water.
Giant kelp is particularly sensitive to changes in climate that alter wave and nutrient conditions. The scientists found that the dynamics of giant kelp growing in exposed areas of the Santa Barbara Channel were largely controlled by the occurrence of large wave events. Meanwhile, kelp growing in protected areas was most limited by periods of low nutrient levels.”
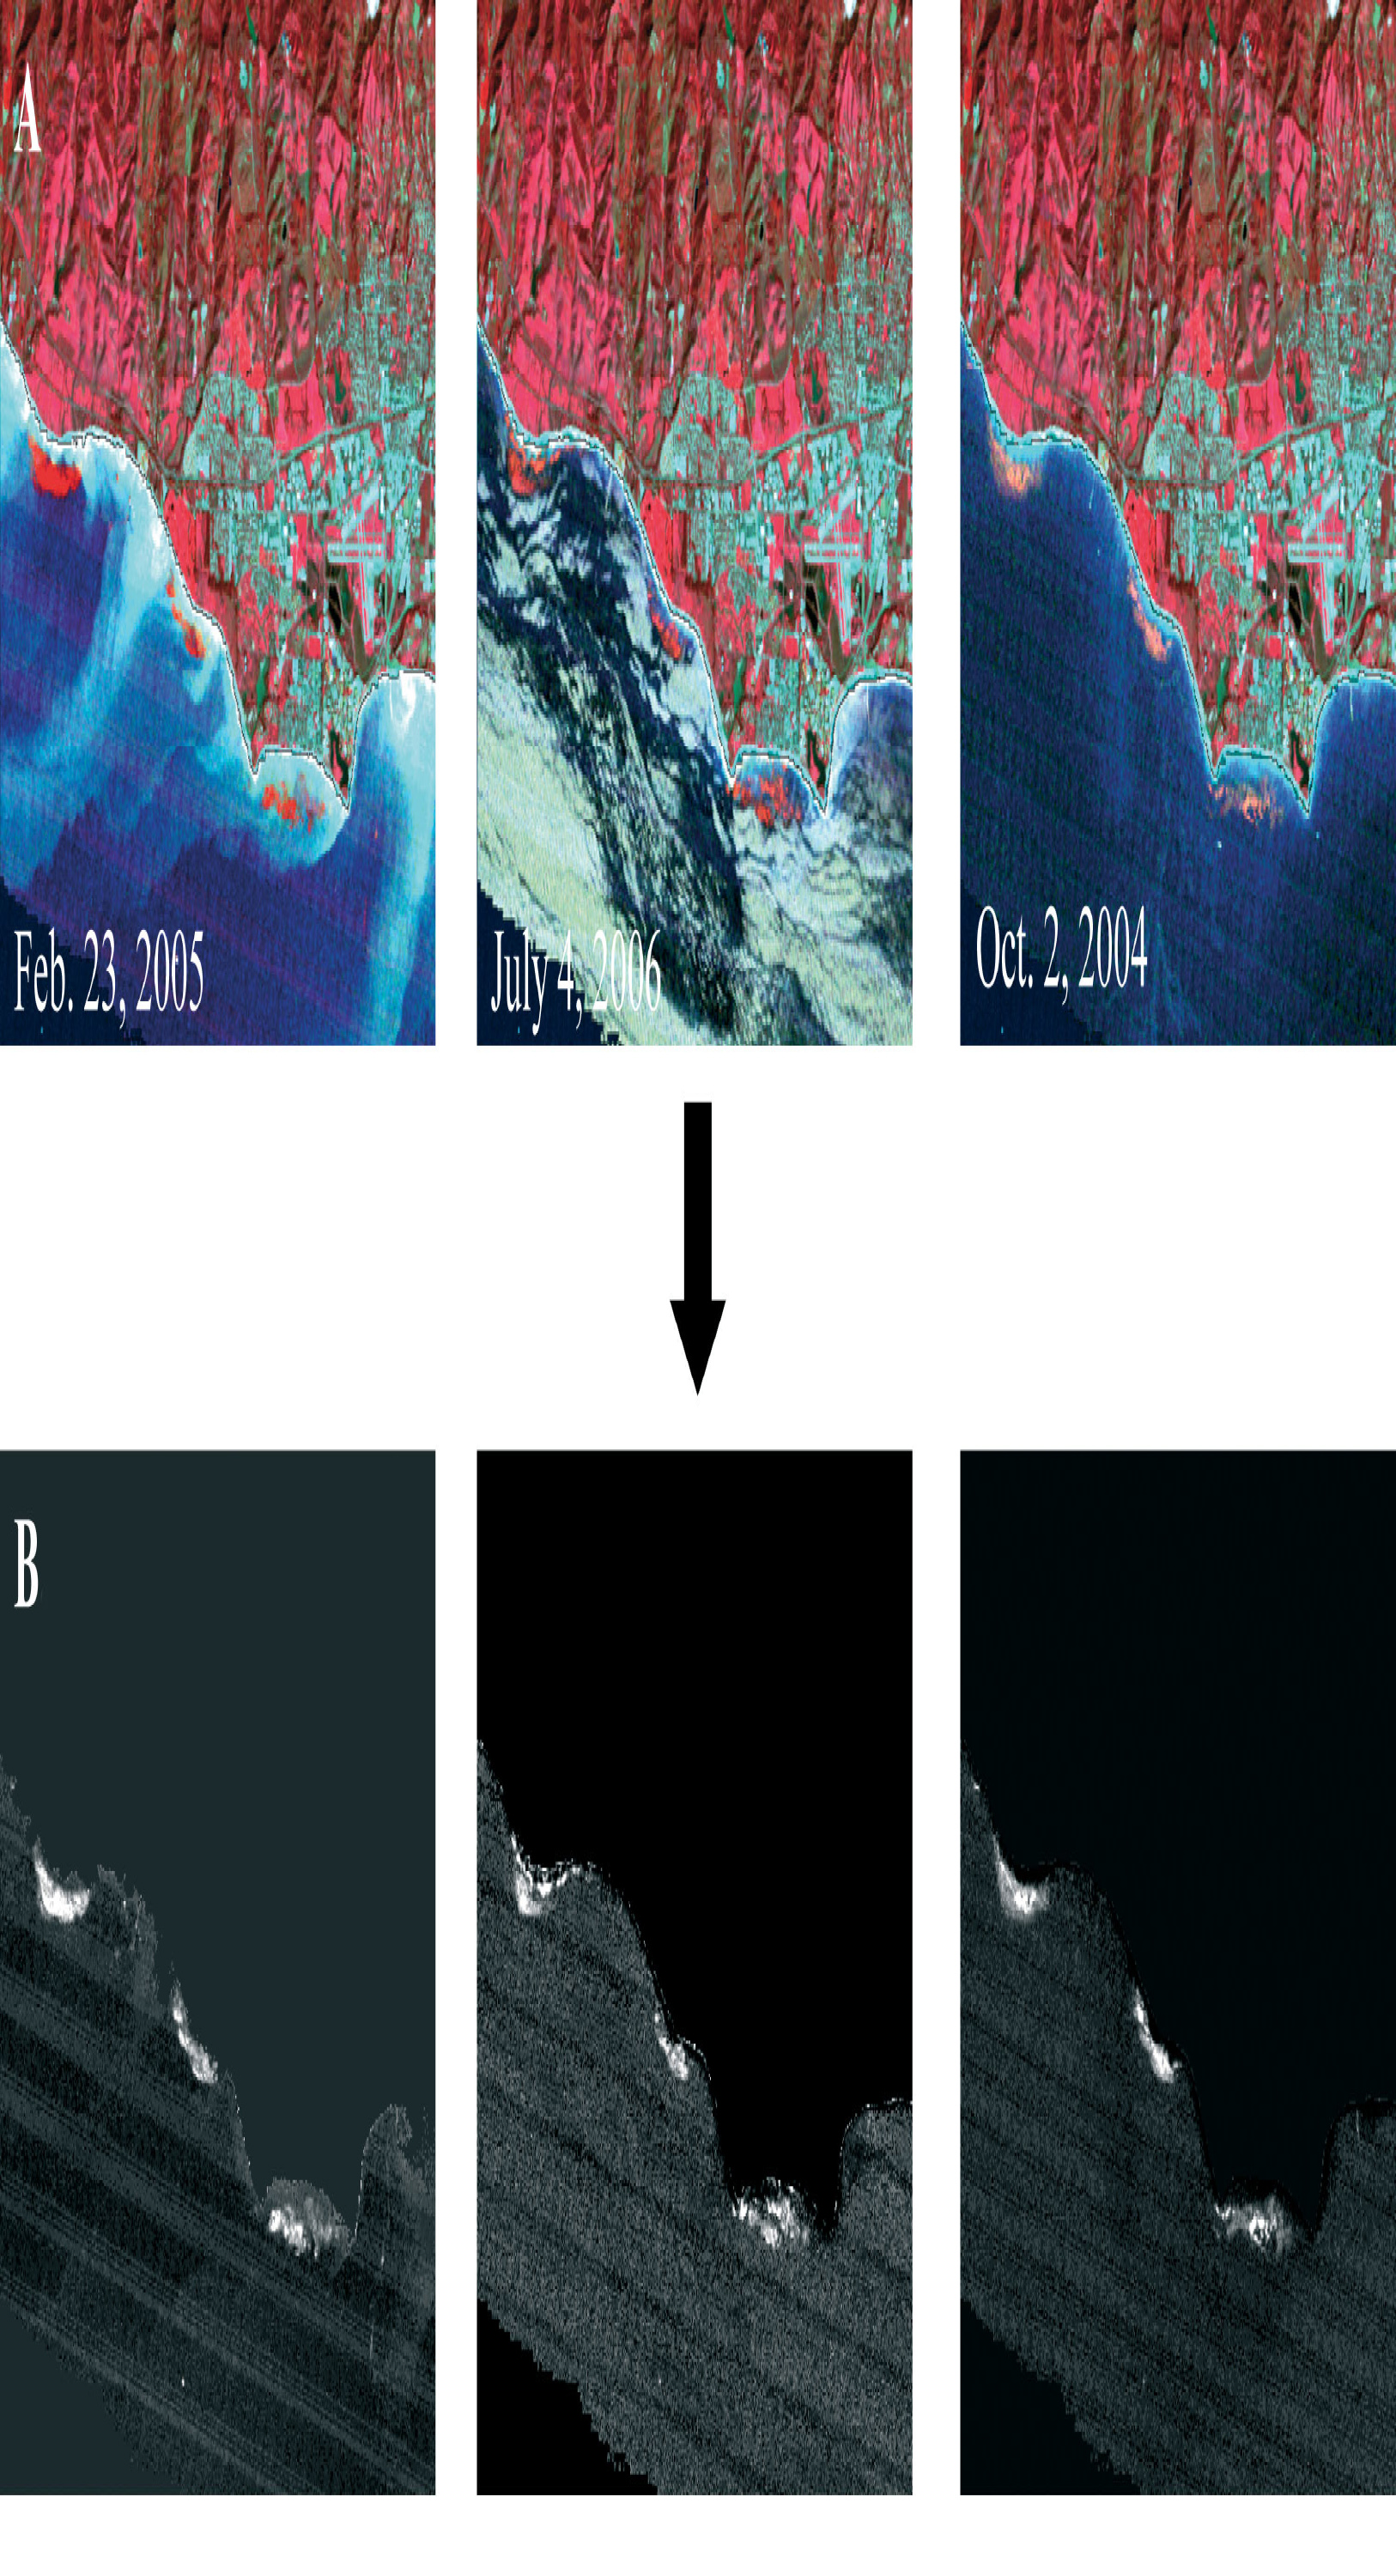
According to Science Daily, “Images from the Landsat 5 satellite provided the research team with a new ‘window’ into how giant kelp changes through time. The satellite was built in Santa Barbara County at what was then called the Santa Barbara Research Center and launched from Vandenberg Air Force Base. It was designed to cover the globe every 16 days and has collected millions of images. Until recently these images were relatively expensive and their high cost limited their use in scientific research.
However, in 2009, the entire Landsat imagery library was made available to the public for the first time at no charge. ‘In the past, it was not feasible to make these longtime series, because each scene cost over $500,’ said Kyle C. Cavanaugh, first author and UCSB graduate student in marine science. ‘In the past, you were lucky to get a handful of images. Once these data were released for free, all of a sudden we could get hundreds and hundreds of pictures through time.’
Giant kelp grows to lengths of over 100 feet and can grow up to 18 inches per day. Plants consist of bundles of ropelike fronds that extend from the bottom to the sea surface. Fronds live for four to six months, while individual plants live on average for two to three years. According to the article, ‘Giant kelp forms a dense floating canopy at the sea surface that is distinctive when viewed from above. …Water absorbs almost all incoming near-infrared energy, so kelp canopy is easily differentiated using its near-infrared reflectance signal.’
Cavanaugh explained that, thanks to the satellite images, his team was able to see how the biomass of giant kelp fluctuates within and among years at a regional level for the first time. ‘It varies an enormous amount,’ said Cavanaugh. ‘We know from scuba diver observations that individual kelp plants are fast-growing and short-lived, but these new data show the patterns of variability that are also present within and among years at much larger spatial scales. Entire forests can be wiped out in days, but then recover in a matter of months.'”