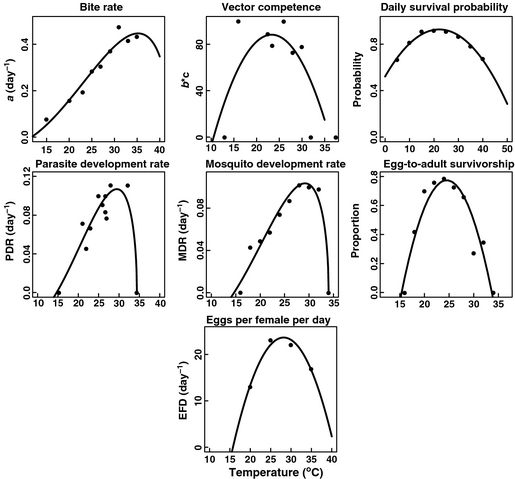
Amy McNally and Emily de Moor recently worked with an interdisciplinary group from EEMB, the Bren School, Geography, and other off-campus colleagues to co-author an article published in Ecology Letters and titled “Optimal temperature for malaria transmission is dramatically lower than previously predicted.” The study challenges prior assumptions by finding that malaria transmission peaks at much cooler temperatures than previously assumed: “Malaria transmission models to date assume constant or linear responses of mosquito and parasite life-history traits to temperature, predicting optimal transmission at 31 °C. These models are at odds with field observations of transmission dating back nearly a century. This study’s model, which includes empirically derived nonlinear thermal responses, predicts optimal malaria transmission at 25 °C (6 °C lower than previous models). Moreover, the model predicts that transmission decreases dramatically at temperatures > 28 °C, altering predictions about how climate change will affect malaria. Using these more accurate nonlinear thermal-response models will aid in understanding the effects of current and future temperature regimes on disease transmission” (UCSB NCEAS news release).
On the paper findings, Emily notes: “Of course, there are numerous factors besides temperature that will determine how malaria transmission is altered with climate change, including precipitation, land cover change, the extent to which a nation is able to distribute bed nets and undertake chemical / biological control of mosquitoes, and others. Nevertheless, I think this paper greatly contributes to our understanding of one important piece of the puzzle”
Amy was happy to contribute to some theory-driven work on the potential impact of climate change that was not all doom-and-gloom – “this work nicely points out that in some places, malaria parasites, vectors, and disease transmission rates will be negatively impacted by increasing temperatures, which might be good for people!”
Emily and Amy received Luce Fellowships in 2010, and their involvement with the malaria study falls under the mission of the Luce Environmental Science to Solutions Fellowship Program “to educate Ph.D. students on the full scope of environmental issues, from the identification of important environmental problems to the implementation of solutions” (see the January 25, 2010 article, “Geography Has Four Luce Fellows”). Amy McNally has an MS in Water Resources Policy and Management from Oregon State University and is currently writing her dissertation on using remotely sensed data to measure and model the relationship between vegetation and soil moisture for agricultural drought applications in African Sahel. Emily has a BA in Biology from Brown University, and has recently completed her MA in Geography examining the impact of HIV/AIDS on household natural resource use, analyzing national data from Kenya.
On her experience working on the project, Emily comments: “It was extremely valuable for me as an entering graduate student to work with such an intelligent, motivated, agreeable, and interdisciplinary group on this important issue of climate change and malaria transmission. The most important lessons I learned from my experience not only involved exposure to unfamiliar methodology, but also the challenges and fulfillment associated with coordinating academics from different backgrounds. The significant findings and publication are icing on the cake and really speaks to Erin Mordecai’s (EEMB) persistence and leadership ability, in addition to the diverse expertise (e.g., Amy McNally’s climate data management) and active involvement of all group members.”
Amy agrees and adds, “In addition to the (fantastic!) personalities in the group, I think we were so successful because we were working within a very quantitative framework – most of the team members had extensive experience working with data and mathematical models. This common ground facilitated communication and integration of each person’s expertise. It was fun to figure out how to merge different datasets to meet the group’s needs – in helping with this paper I figured out a lot of new computer programming and data management tricks that have benefited my other work.” Amy is continuing to work with the group, mapping the model results across Africa for comparison with other studies that have investigated the current distribution of transmission and future projections using climate change scenarios.
Editor’s note: Many thanks to Amy and Emily for providing the material for this posting, and kudos to them both for such exemplary scholarship.