The following is a Google Research Blog posted by Matt Hansen and Peter Potapov, University of Maryland, and Rebecca Moore and Matt Hancher, Google, with the title above:
Most people are familiar with exploring images of the Earth’s surface in Google Maps and Earth, but of course there’s more to satellite data than just pretty pictures. By applying algorithms to time-series data it is possible to quantify global land dynamics, such as forest extent and change. Mapping global forests over time not only enables many science applications, such as climate change and biodiversity modeling efforts, but also informs policy initiatives by providing objective data on forests that are ready for use by governments, civil society, and private industry in improving forest management.
In a collaboration led by researchers at the University of Maryland, we built a new map product that quantifies global forest extent and change from 2000 to 2012. This product is the first of its kind, a global 30 meter resolution thematic map of the Earth’s land surface that offers a consistent characterization of forest change at a resolution that is high enough to be locally relevant as well. It captures myriad forest dynamics, including fires, tornadoes, disease, and logging.
The satellite data came from the Enhanced Thematic Mapper Plus (ETM+) sensor onboard the NASA/USGS Landsat 7 satellite. The expertise of NASA and USGS, from satellite design to operations to data management and delivery, is critical to any earth system study using Landsat data. For this analysis, we processed over 650,000 ETM+ images in order to characterize global forest change.
Key to the study’s success was the collaboration between remote sensing scientists at the University of Maryland, who developed and tested models for processing and characterizing the Landsat data, and computer scientists at Google, who oversaw the implementation of the final models using Google’s Earth Engine computation platform. Google Earth Engine is a massively parallel technology for high-performance processing of geospatial data, and it houses a copy of the entire Landsat image catalog. For this study, a total of 20 terapixels of Landsat data were processed, using one million CPU-core hours on 10,000 computers in parallel, in order to characterize year 2000 percent tree cover and subsequent tree cover loss and gain through 2012. What would have taken a single computer 15 years to perform was completed in a matter of days using Google Earth Engine computing.
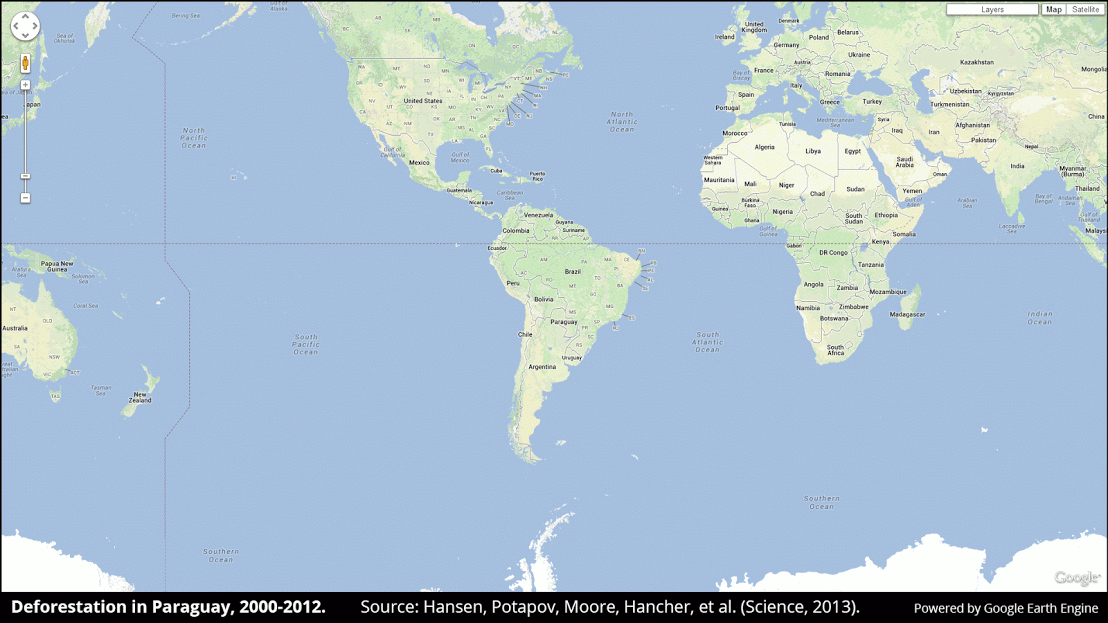
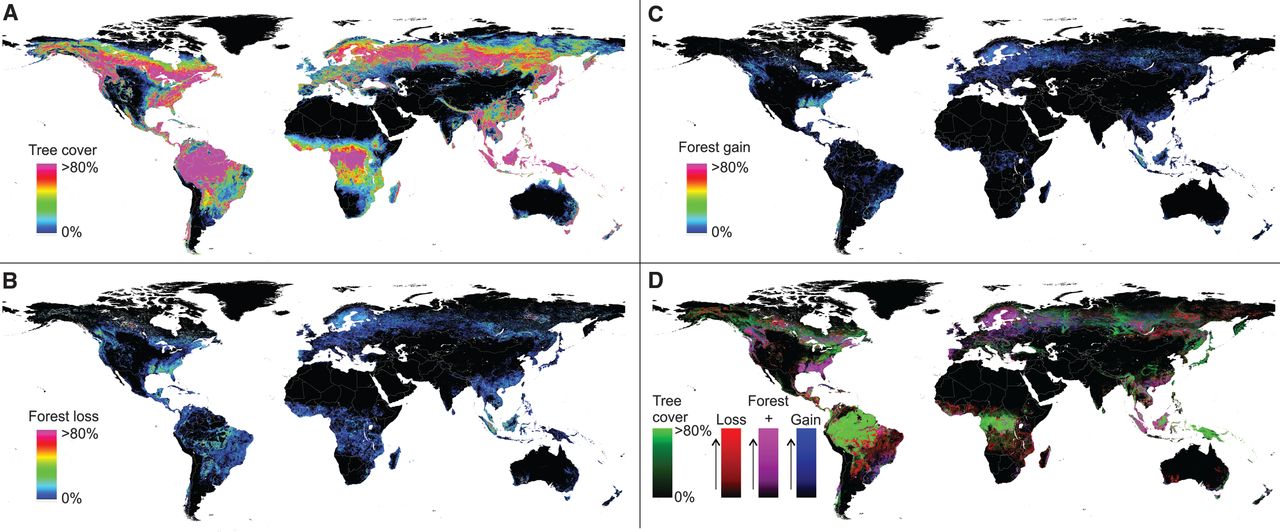
Global forest loss totaled 2.3 million square kilometers and gain 0.8 million square kilometers from 2000 to 2012. Among the many results is the finding that tropical forest loss is increasing with an average of 2,101 additional square kilometers of forest loss per year over the study period. Despite the reduction in Brazilian deforestation over the study period, increasing rates of forest loss in countries such as Indonesia, Malaysia, Tanzania, Angola, Peru, and Paraguay resulted in a statistically significant trend in increasing tropical forest loss. The maps and statistics from this study fill an information void for many parts of the world. The results can be used as an initial reference for countries lacking such information, as a spur to capacity building in such countries, and as a basis of comparison in evolving national forest monitoring methods. Additionally, we hope it will enable further science investigations ranging from the evaluation of the integrity of protected areas to the economic drivers of deforestation to carbon cycle modeling.
For more, see the global map of forest change by Matt Hansen and colleagues from UMD, Google, USGS, NASA, and the Moore Foundation, as well as the November 15, 2013 Science publication of the study, “High-Resolution Global Maps of 21st-Century Forest Cover Change.”
Editor’s note: Many thanks to graduate student Song Gao for bringing this material to our attention.

.jpg)
.jpg)