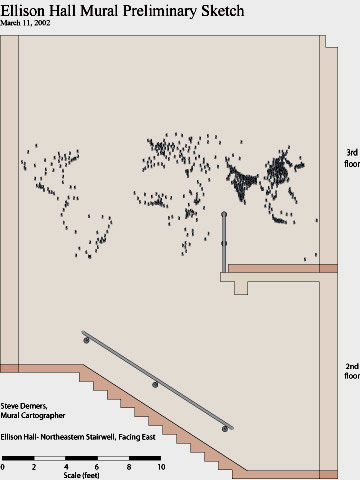
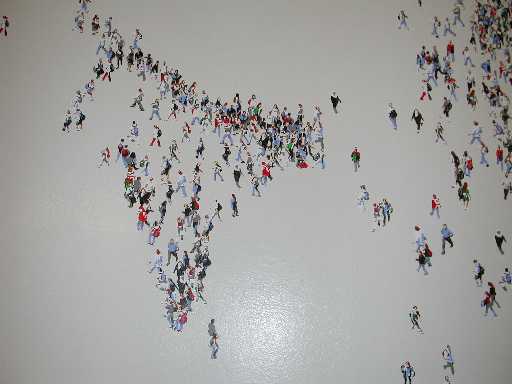
It’s hard not to notice the huge world population mural on the wall in the north wing (east side) of the third floor stairwell of Ellison Hall. Alumnus Steve Demers created it shortly before getting his BA in Geography in 2002: “As my college years began coming to a close, I sought to find my niche in cartography. After seeing hundreds of maps that were either accurate and scientific but ugly, or beautiful and attractive but just plain wrong, I knew my niche would be trying to combine the two. In line with my painting background and my desire to make big maps, mural cartography was born.” The project was funded by Professor Keith Clarke, and Steve spent several weeks completing the project. If you look closely, you’ll notice that Steve used several different figures in the mural, each one painted by hand.
Steve titled his mural “Where Are We?,” because he felt that the title “perfectly captures the goal of the mural. For those who don’t see the spatial pattern of the mural, this might very well be the question they’ll be asking themselves. However, for those who do see the map, the map itself answers this question. The mural, in a sense, shows where we (humans) are. As a map of world population distribution, it very simply but elegantly answers that question.”
The figures began as photos of people walking around campus that Steve shot from the 5th floor of Ellison Hall. He then stylized the photos in Illustrator and, working on a scaffold, carefully hand painted each stock figure across the 20-foot span of walls. Each person equals ten million people, which meant that Steve had to paint 610 of them to account for the 6.1 billion world population count at that time—the painting alone took him 87 hours. Steve’s map uses a Robinson Projection of the world, and, technically, it is a non-contiguous cartogram, a type of graphic that depicts attributes of geographic objects as the object’s area.
“The purpose of this mural, and all my future murals, is to combine the art and science of cartography. I wanted the observer to learn something about world population, but by seeing it in a way they never had before. By leaving out continent outlines, by leaving out names of countries or names of cities, by leaving out any sort of reference to the physical world the observer is forced to see the distribution of world population without a context. I love how by simply placing images to represent an area comprising 10 million people, continent coastlines, mountain ranges and even river valleys become distinguishable. The observer essentially is making a map for him or herself in reverse.”
Steve currently works at the Riverside County Tax Assessor’s office in their Mapping Department. For Steve’s comprehensive description of his creation and his philosophy of his cartographic art, see Mural Cartography: Combining the Art and Science of Map Making.
Article by Bill Norrington