Pamela Dalal is a Ph.D. student in Geography at UCSB, studying how people interact with their urban environments. As a geographer, Pamela is convinced that by mapping societal and urban trends, she can provide additional insight into what drives people and what drives cities.
Accordingly, Pamela puts her maps where her mouth is by taking interesting news articles or studies, mining the original data source, and then mapping the findings. She feels that the spatial trends of these findings are just as thought-provoking as the published results, and her blog, “The Dalal Daily,” strives “to communicate the findings of the studies visually, for her own creative pleasure and for better public dissemination.” The following is Pamela’s first blog, posted December 3, 2012, titled “Where have all the drivers gone?”
A recent study found that the percent of 19-year olds with a driver’s license has been declining since 1983. This phenomenon is interesting because it suggests a peaking of the auto-era, a major boon to our congested and over-capacity urban infrastructure. While the results are promising, I wondered if where this trend occurs can explain why it occurs.
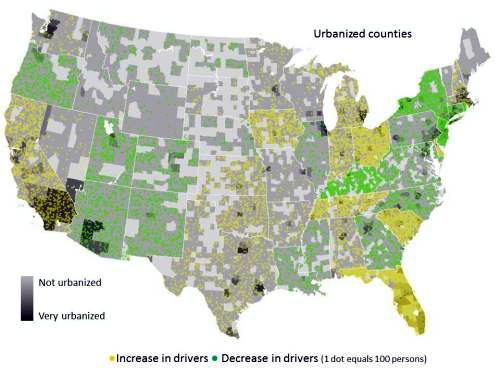
The authors of the study list three reasons that may explain this trend. First, teens are taking advantage of electronic communication (social media, Netflix) to fulfill their entertainment and social needs. Second, the cost and maintenance of the vehicle is less affordable given the economic recession, reducing demand. Third, more young people are moving to highly urbanized areas where public transit is both available and competent. To better understand this trend, the accompanying maps illustrate the decrease (and increase) in driver’s licenses, state-by-state. The data on drivers comes from the 1995-2010 Federal Highway Administration; data regarding urbanization and populations are from the 2010 U.S. Census Bureau. When broken down by state, several states show a decline in driver’s licenses between 1995 and 2010 (green dots indicate fewer drivers, yellow dots indicate more drivers).
To consider the conclusion that urban migration is a factor, there should be an increase in urbanized areas and a decrease in rural areas. California, Texas, and Florida have the most sq. miles of urbanized land (2010 U.S. Census), and all three states have an increase in the number of driver’s licenses. In 2010, the most 19-year olds lived in California, New York, and Texas, and only New York shows a decline. If 19-year olds are leaving rural states for California, Texas, and Florida, they are leaving by car and staying licensed.
As for the prohibitive cost of owning a vehicle, Alabama, South Carolina, and Nevada have the lowest employment rates for the age group, but all show increases in licenses. High gas taxes don’t correlate with decreased rates, led by California. But the high car insurance in New Jersey, Louisiana, and New York (ranked 2-4 in cost, respectively) lines up best with the decline in driver’s licenses.
Finally, the study concludes that social media also play a factor in reducing the need to drive, but that does not explain why driver’s licenses amongst teens declined before Facebook or text messaging. The use of spatial references provides new insights and, often, more questions on the causes behind national trends. A key question here is how the urban landscape and demographics lead to a common trend in the Mountain West, the Southeast, and the Bos-Wash corridor.