Many thanks to Karl Grossner for contributing this fascinating material:
One of my careers before arriving at UCSB to get a geography PhD involved designing web software and building web sites. Since completing the degree in December 2010, I’ve built three web sites. Hmm…so what has changed? Well, the sites are much more interesting, I think, but I’ll let others be the judge. They are certainly more scholarly; in fact, my colleague Elijah Meeks and I have taken to calling them interactive scholarly works, even using the ISW acronym at times. I’m sending this communique in part to pass along a story of an “alt-ac” career in the making and partly to publicize the sites because they are decidedly geographic and/or spatial. Alt-ac stands for “alternate academic” and refers to pretty much everything someone with a doctorate might do in academia that doesn’t involve a tenure-track position. That said, many ‘alt-acs’ are ABD.
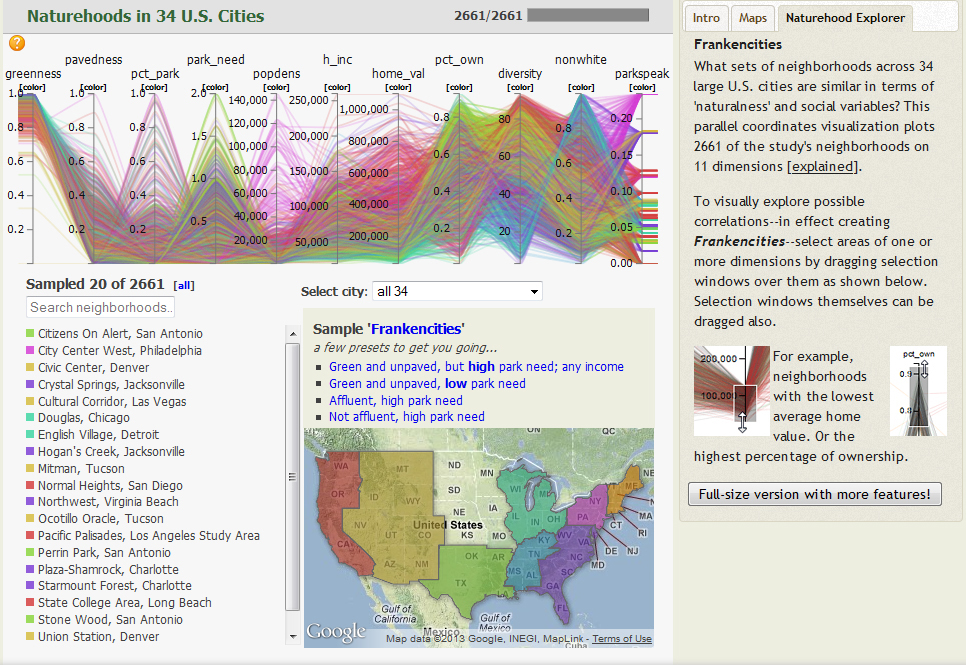
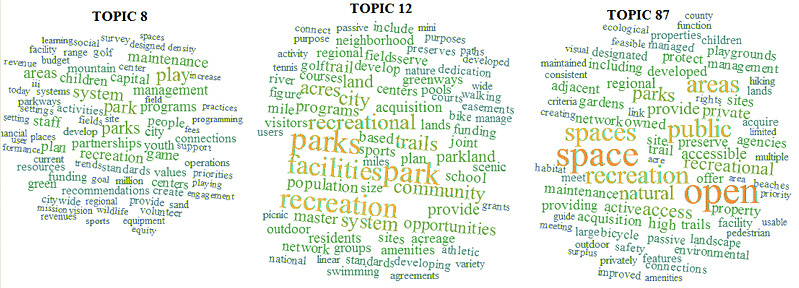
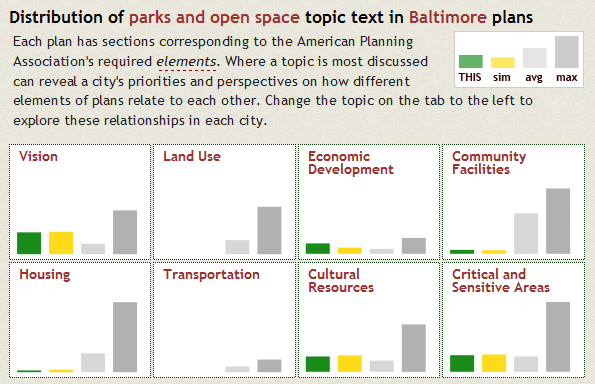
After completing a one year post-doc in the Spatial Center – resulting in a web site, of course (teachspatial.org) – I took a job with Stanford University Libraries as a Digital Humanities Research Developer. I’ll explain what that means momentarily, but first a few words about the two web sites that have resulted so far. Most recently, City Nature launched in mid-March (http://citynature.stanford.edu). My work for the project has involved developing two datasets and some digital tools for exploring them, all aimed at explaining the considerable variation in the quantity and quality of city nature between and within cities. Dataset one combines new “distance to park-level green” and “distance to park-level un-pavedness” surfaces derived from the 2006 satellite data (NLCD) with several 2010 census variables, all at the scale of neighborhoods for 38 large U.S. cities. Dataset two is the complete text of the Comprehensive Plans from 37 of those cities, as well as a topic model generated from it. We learned there is no significant correlation between levels of greenness, park acreage, and park access, and social variables, including affluence, diversity, and race. This means explanations must be found in historical investigations of planning processes, which is under way but not reported on the site. The site explains it all – hopefully, well enough—with lots of interactive maps, other visualizations, and a short essay or two.
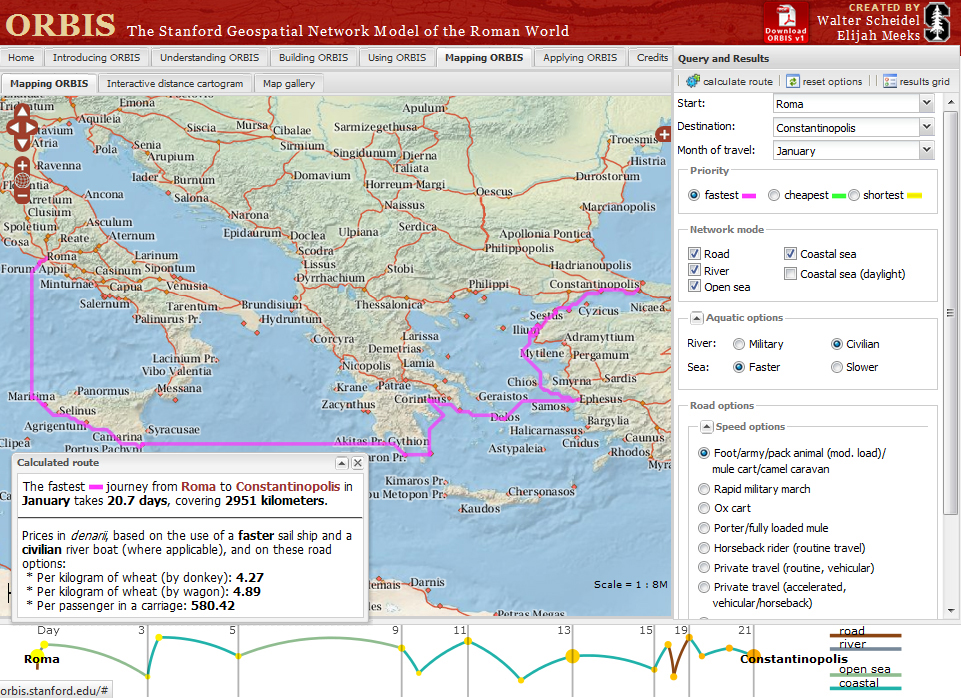
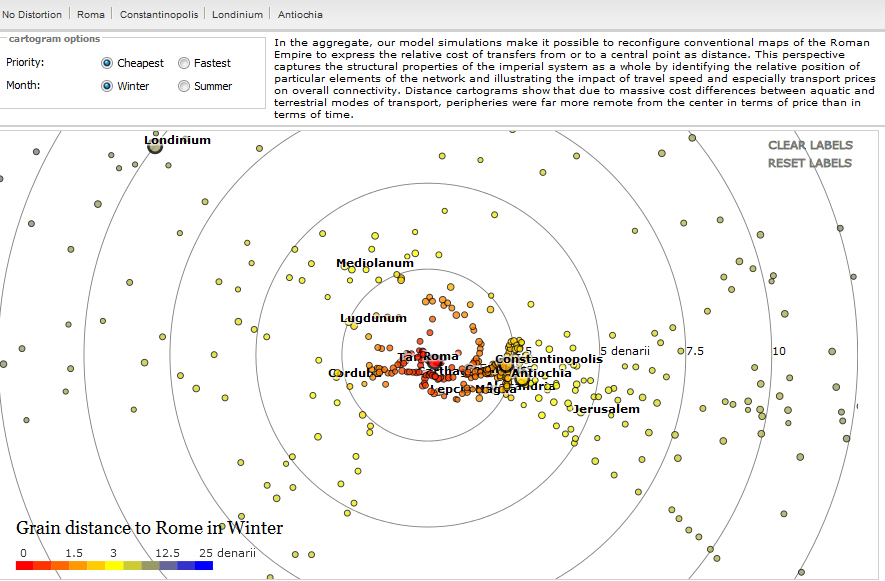
The first site I built upon arriving at Stanford was ORBIS: The Stanford Geospatial Network Model of the Roman World (http://orbis.stanford.edu), released last May. ORBIS has received a fair bit of attention (half a million visitors), from several scholarly communities and Rome enthusiasts world-wide. In this case, I was responsible only for the web site—the novel multimodal network transport model and some nice dynamic distance cartograms were developed by Elijah Meeks, and the historical scholarship informing edge weights was that of Dr. Walter Scheidel. Since it launched, I’ve developed a simple API and published some of the data to the Linked Data cloud.
What’s up for 2013 is archaeology—more specifically, archaeological data modeling. In time-honored geographic tradition, the model will be spatial, temporal, and thematic (that is, semantic). The data is everything from the amazing Çatalhöyük project in Turkey, directed for the last 20 years by Stanford’s Ian Hodder. Hodder wants the data to be made more useful to the many teams involved and more accessible globally. The modeling vision—reorganizing the data such that it may be readily re-interpreted—is simply stated but presents many challenges. Really, it’s a question of representing not only the scientific evidence, but also the circumstances of its discovery, as well as current interpretations. A fantastic opportunity for this ontology engineer, really.
The answer, then, to what a “Digital Humanities Research Developer” is? In this case, it’s someone who spends a year or so each on fascinating projects, two at a time. I forgot to mention Kindred Britain, launching in a month or two. That one is a network of around 28,000 Britons (mostly) over a thousand year period, all related by birth or marriage. In case you were wondering, yes, Sir Francis Bacon is related to Kevin Bacon. A story for another day.