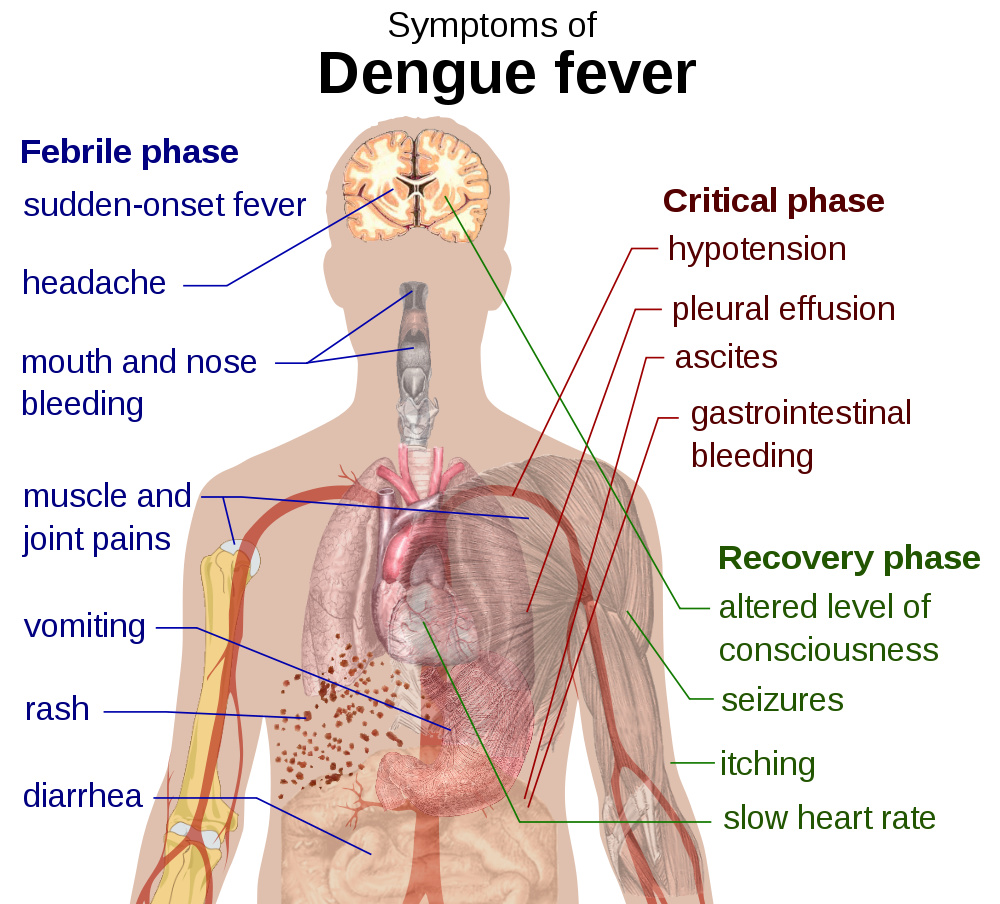
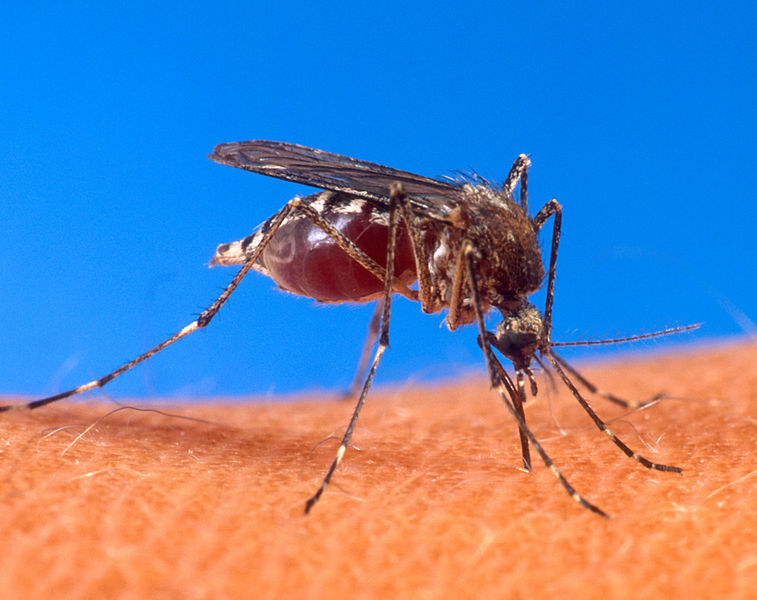
Professor Arthur Getis, Distinguished Professor of Geography, Emeritus, at San Diego State University, recently sent the following observation to UCSB Geography: “I have spoken about the transmission of infectious diseases on a couple of occasions in the Department of Geography at Santa Barbara. Now, with climate change so prominent in our minds, there is a need to know the extent of tropical disease spread. Research has begun to show that diseases in the tropics, such as dengue fever, are being recorded in areas previously too cool (especially in the winter) for their transmission. A recent (2010) modest outbreak in Florida may be a harbinger of what we, Kris Kuzera, a SDSU/UCSB Ph.D. and I, found in northern Thailand. Warmer cool-season temperatures and increasing numbers of dengue hemorrhagic fever cases appear to be associated while the habitat for the dengue vector, mainly the Aedes aegypti mosquito, increases in size. For a spatial view of dengue see “Characteristics of the Spatial Pattern of the Dengue Vector, Aedes aegypti, In Iquitos, Peru” by Arthur Getis, et al. in the American Journal of Tropical Medicine and Hygiene (69(5), 2003).”
As an article in the May 2011 Issue of PLoS Neglected Tropical Diseases points out, “A variety of obstacles, including bureaucracy and lack of resources, delay detection and reporting of dengue and exist in many countries where the disease is a major public health threat. Surveillance efforts have turned to modern data sources such as Internet usage data. People often seek health-related information online and it has been found that the frequency of, for example, influenza-related web searches as a whole rises as the number of people sick with influenza rises. Tools have been developed to help track influenza epidemics by finding patterns in certain web search activity. However, few have evaluated whether this approach would also be effective for other diseases, especially those that affect many people, that have severe consequences, or for which there is no vaccine. In this study, we found that aggregated, anonymized Google search query data were also capable of tracking dengue activity in Bolivia, Brazil, India, Indonesia and Singapore. Whereas traditional dengue data from official sources are often not available until after a long delay, web search query data is available for analysis within a day. Therefore, because it could potentially provide earlier warnings, these data represent a valuable complement to traditional dengue surveillance” (Chan, E., Sahai, V., Conrad, C. and Brownstein, J. “Using Web Search Query Data to Monitor Dengue Epidemics: A New Model for Neglected Tropical Disease Surveillance”).
The new Google tracking mechanism referred to above, similar to the tool it released in 2008 for flu trends, is Google Dengue Trends which is intended to act as an early warning system for outbreaks of the disease. Though Dengue Trends is similar to Flu Trends, the new tool adds another layer of research, Google Correlate. Google Correlate shows related search terms and provides a snapshot of search activity over a period of time. The idea behind it is to expose previously unknown connections among search terms. “We have also found a close relationship between how many people search for dengue-related topics and how many people actually have dengue symptoms. Of course, not every person who searches for “dengue” is actually sick, but a pattern emerges when all the dengue-related search queries are added together. We compared our query counts with traditional dengue surveillance systems and found that many search queries tend to be popular exactly when dengue season is happening. By counting how often we see these search queries, we can estimate how much dengue is circulating in different countries and regions around the world… So why bother with estimates from aggregated search queries? Traditional dengue surveillance is very important, but most health agencies focus on a single country or region and only update their estimates once per week, month or even year. Google Dengue Trends is currently available for a number of countries around the world and is updated every day, providing a complement to these existing systems. For epidemiologists, this is an exciting development, because early detection of a disease outbreak can reduce the number of people affected. Our up-to-date dengue estimates may enable public health officials and health professionals to better respond to seasonal outbreaks” (source).
Article by Bill Norrington, with thanks to Art Getis for the inspiration
.jpg)