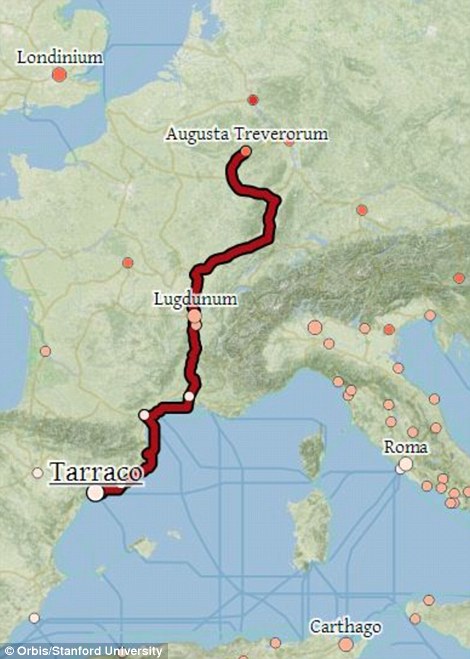
“Imagine you’re in Rome, it’s 205 CE, and you’ve got to figure out the quickest way to transport wheat to Virunum, in what’s now Austria. Your transportation choices are limited: ox cart, mule, ship or by foot, and your budget is tight. What do you do? Enter ORBIS: The Stanford Geospatial Network Model of the Roman World. With it, you can survey the options that would have been available to an ancient Roman in that very predicament with the ease of getting directions via GPS.
Type in your starting point, destination, the goods you need to move, and the time of year. Voila! You can quickly see the most cost-effective way to transport the grain. By generating new information about the ancient Roman transport network, ORBIS demonstrates how, more than anything else, the expansion of the empire was a function of cost. ORBIS reconstructs the time spent and financial expense associated with pre-modern travel. By simulating movement along the principal routes of the Roman road network, the main navigable rivers, and hundreds of sea routes, the interactive route map recreates the infrastructure of the entire pre-modern Roman world in a way that has never been done before” (Stanford News).
Stanford Classics Professor Walter Scheidel and Stanford Digital Humanities Specialist Elijah Meeks developed the highly detailed digital model in collaboration with a group of IT specialists and students at Stanford. UCSB Geography alumnus Karl Grossner (PhD 2010) conceived and built the ORBIS web site as a digital scholarly publication, integrating Meeks’ GIS routing application and supporting visualizations with an embedded scholarly article co-authored by Scheidel, Meeks, and two student contributors. “ORBIS is dynamic, not static, and functions both as a publication and as a tool for the creation of new information,” Scheidel said. By allowing users to experiment with a huge number of data combinations, “it lets users do things that could not be done on the printed page.”
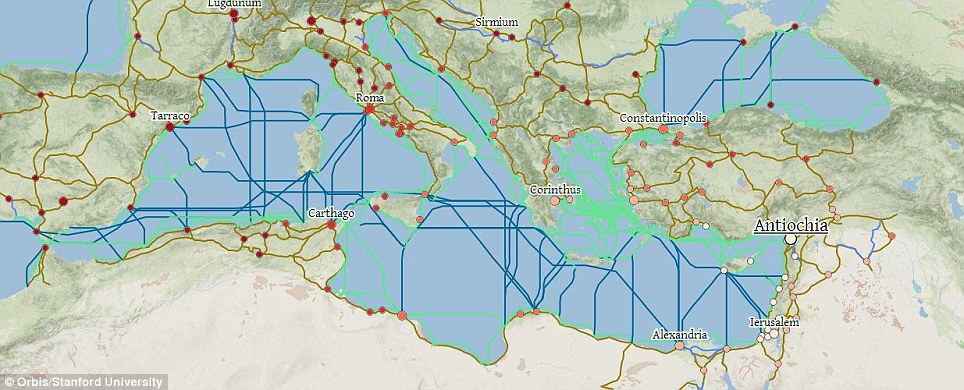
Although historians have plotted the thousands of destinations and the land and sea routes that traversed the three continents of the Roman Empire, ORBIS integrates real-life scenarios that illustrate how the empire was held together through trade routes. “Traditional maps fail to capture the severe environmental constraints that governed the flows of people, goods and information,” said Scheidel, whose research interests focus on ancient social and economic history. In recreating an ancient journey, an ORBIS user can take into account seasonal conditions, 14 modes of road travel from camel caravan to military march, different types of ships and various speeds of travel. Together, these factors reveal how the Romans came to perceive time and distance” (Ibid.)
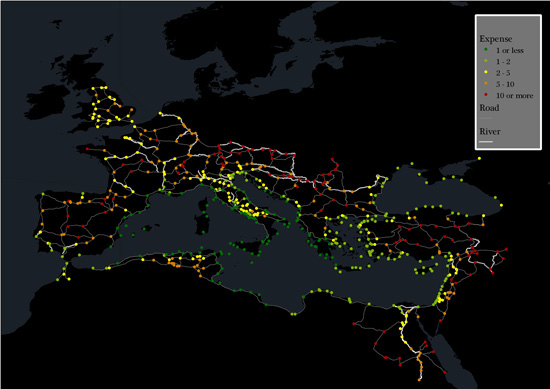
“The model consists of 632 sites, most of them urban settlements but also including important promontories and mountain passes, and covers close to 10 million square kilometers (~4 million square miles) of terrestrial and maritime space. 301 sites serve as sea ports. The baseline road network encompasses 84,631 kilometers (52,587 miles) of road or desert tracks, complemented by 28,272 kilometers (17,567 miles) of navigable rivers and canals.
Sea travel moves across a cost surface that simulates monthly wind conditions and takes account of strong currents and wave height. The model’s maritime network consists of 1026 sea routes (linking 513 pairs of sites in both directions), many of them documented in historical sources and supplemented by coastal short-range connections between all ports and a few mid-range routes that fill gaps in ancient coverage. Their total length, which varies monthly, averages 192,810 kilometers (119,806 miles). Sea travel is possible at two sailing speeds that reflect the likely range of navigational capabilities in the Roman period. Maritime travel is constrained by rough weather conditions (using wave height as proxy). 158 of the sea lanes are classified as open sea connections and can be disabled to restrict movement to coastal and other short-haul routes, a process that simulates the practice of cabotage as well as sailing in unfavorable weather. For each route, the model generates two discrete outcomes for time and four for expense in any given month (http://orbis.stanford.edu/).
“ORBIS was launched not as a fixed object, but as an interactive platform that Scheidel and Meeks are making available to other scholars and the general public. The site will be continually updated in response to user feedback. Scholarship that is made possible by the model will be posted on the site itself as open access digital publications. By adding more data, users can extend the sea surface and apply the model anywhere on the globe, making the model “infinitely expandable,” said Scheidel. Scheidel anticipates that users will formulate their own questions as they experiment with the site. His hope is that ORBIS will help “create a new approach to our understanding of connectivity in a pre-modern society”” (Stanford News, op. cit.)
Editor’s note: For more about Karl Grossner‘s work with ORBIS, see the March 18, 2013 article, “Notes from the Farm,” that he contributed. Many thanks to Stella Larson for bringing this material to our attention.


If you would like to be on our mailing list of latest news postings, or if you have anything relating to the Department that you consider noteworthy, interesting, or just plain fun that you would like to share, please contact the news editor News Editor