The wide, wonderful, and sometimes whacky world of mapmaking has been in the forefront of the news recently. For example, the Huffington Post featured an article called “The Happiest States in America in One Map” about two weeks ago (see the original PLoS ONE article here) and recently followed it up with maps illustrating an article titled “Socioeconomic Stress Leaves Lasting Scars.” That was followed by another article about a guy named Gretzinger who has spent the last 50 years creating an ever-changing imaginary map and plans on continuing the project for at least another 20 years – and yet another article about the infamous “Area 51” which includes a map of the area, although, alas, no aliens are depicted: “The government shed some light on an age-old mystery on Thursday, releasing documents that included the location and first official government acknowledgment of the secretive Area 51 facility, a staple of conspiracy theories about alien life and futuristic government technology.”
Another internet site, www.buzzfeed.com, recently featured an article called “Amazing Maps Is Your New Favorite Twitter Account” and gives a few delightful examples. It also links to yet another site with a well-illustrated and intriguing article called “40 maps that explain the world.”
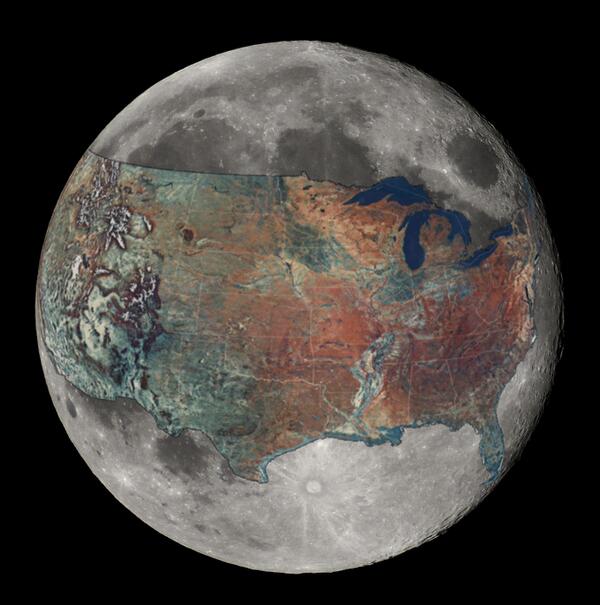
Maps have always been in the news; indeed, they literally have been the news in many instances. As Wikipedia points out, “A map is a visual representation of an area – a symbolic depiction highlighting relationships between elements of that space such as objects, regions, and themes. Many maps are static two-dimensional, geometrically accurate (or approximately accurate) representations of three-dimensional space, while others are dynamic or interactive, even three-dimensional. Although most commonly used to depict geography, maps may represent any space, real or imagined, without regard to context or scale; e.g. brain mapping, DNA mapping, and extraterrestrial mapping. Although the earliest maps known are of the heavens, geographic maps of territory have a very long tradition and exist from ancient times. The word ‘map’ comes from the medieval Latin Mappa mundi, wherein mappa meant napkin or cloth and mundi the world. Thus, ‘map’ became the shortened term referring to a 2 dimensional representation of the surface of the world” (source).
Wikimedia Commons, “the free media repository,” has some excellent maps depicted on its “Featured Maps” page. However, if you’re interested in less conventional maps, Frank Jacobs’ blog on “Strange Maps” is a must – he illustrates and discuses hundreds of them (over 600 to date). “Frank Jacobs loves maps, but finds most atlases too predictable. He collects and comments on all kinds of intriguing maps—real, fictional, and what-if ones—and has been writing the Strange Maps blog since 2006, first on WordPress and now for Big Think.”
Closer to home, the UCSB Department of Geography offers courses on maps and mapping that will stimulate more academic interests in the subject. Evidently, the Department also harbors the anonymous “Dr. Map,” who launched his cartographic blog about “map crap” in 2004. Some excerpts from Dr. Map’s blog, as well as a fascinating discussion of “toponymy” by UCSB Geography Professors Dan Montello and Keith Clarke, can be found here.
Not only does UCSB’s Ellison Hall house several experts in cartography, it also houses an excellent example of cartography as art. “It’s hard not to notice the huge world population mural on the wall in the north wing (east side) of the third floor stairwell of Ellison Hall. Alumnus Steve Demers created it shortly before getting his BA in Geography in 2002: ‘As my college years began coming to a close, I sought to find my niche in cartography. After seeing hundreds of maps that were either accurate and scientific but ugly, or beautiful and attractive but just plain wrong, I knew my niche would be trying to combine the two. In line with my painting background and my desire to make big maps, mural cartography was born.’ The project was funded by Professor Keith Clarke, and Steve spent several weeks completing the project. If you look closely, you’ll notice that Steve used several different figures in the mural, each one painted by hand” (source).
UCSB also boasts the Davidson Library’s Map & Imagery Laboratory (MIL), which contains maps, aerial photographs, and other types of remote sensing data and GIS data from around the globe. It is the largest such collection in any academic library in the U.S. MIL serves the academic and research needs of the University of California, the state university system, business, industry, federal and state government, and other domestic and foreign educational institutions (see more here).
Editor’s note: The Geography and Map Division (G&M) of the U.S. Library of Congress has custody of the largest and most comprehensive cartographic collection in the world, with collections numbering over 5.5 million maps, 80,000 atlases, 6,000 reference works, over 500 globes and globe gores, 3,000 raised relief models, and a large number of cartographic materials in other formats, including over 38,000 CDs/DVDs. The online Map Collections represents only a small fraction that have been converted to digital form. These images were created from maps and atlases and, in general, are restricted to items that are in public domain, meaning those which are not covered by copyright.
Article by Bill Norrington

.jpg)