The following is a Duke University news article posted May 29, 2014 and titled “New Technologies Making It Easier to Protect Threatened Species”:
Human actions have pushed extinction rates to 1,000 times faster than the natural rate, but a new Duke University-led study finds that emerging technologies could give scientists and policymakers a more efficient way to identify the species at greatest risk and take steps to protect them before it’s too late. “Online databases, smartphone apps, crowd-sourcing, and new hardware devices are making it easier to collect data on species,” said Stuart L. Pimm, Doris Duke Professor of Conservation Ecology at Duke. “When combined with data on land-use change and the species observations of millions of amateur citizen scientists, technology is increasingly allowing scientists and policymakers to more closely monitor the planet’s biodiversity and threats to it.” “For our success to continue, however, we need to support the expansion of these technologies and the development of even more powerful technologies to come,” he said.
In a paper published today in the journal Science, Pimm and an international team of scientists review recent advances in conservation science made possible by new technologies, as well as challenges that remain unmet. Despite recent progress, the scientists note, many uncertainties remain as to how many species there are, where they are, and their rates of extinction. “Most species remain unknown to science, and they likely face greater threats than the ones we do know,” Pimm said. Without urgent action, further rises in extinction rates are likely, heralding what many believe could become the sixth mass extinction in Earth’s history.
“The great depth of our current assessment is only possible thanks to the extraordinary efforts of all those who contribute to the databases of the Red List of Threatened Species and of Protected Planet,” noted Tom Brooks of the International Union for Conservation of Nature. “We need to stimulate the investment essential to maintain these knowledge products, and to support the expansion of the Red List from its current coverage of 70,000 species to 160,000 species.” The Red List, now in its 50th year, is at www.iucnredlist.org. The Protected Planet database is at www.protectedplanet.net.
The value of such databases, Pimm said, is that they help scientists spot trends and patterns that might otherwise be missed. “For instance, we now know that most land-based species have small geographical ranges — smaller than the U.S. state of Delaware — and are geographically concentrated. The same pattern seems to hold for marine life, according to new data we are reviewing. Species with small ranges are disproportionately likely to go extinct,” Pimm said. “This knowledge offers the hope that we can concentrate our conservation efforts on critical places around the planet.”
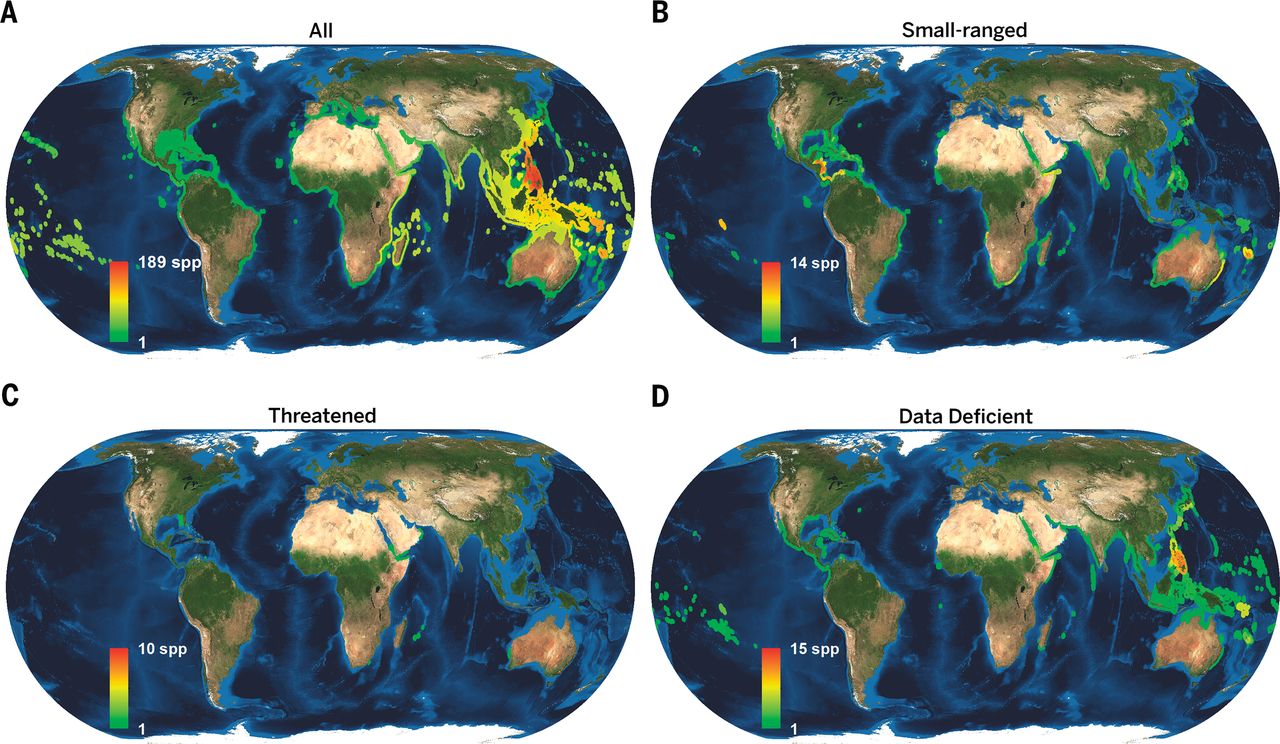
Pimm added that another vital tool for identifying these critical places are new maps created by Clinton Jenkins of the Instituto de Pesquisas Ecológicas in Brazil and co-lead author of the new study. Jenkins’ maps show where the most vulnerable species live. He manages a website that makes the constantly updated maps available to the public. He and Pimm also direct the nonprofit organization SavingSpecies, www.savingspecies.org, that uses detailed maps of where endangered species live to set conservation priorities and support local conservation actions to prevent extinctions.
Technologies such as these databases and maps are now allowing scientists to expand their focus and identify important patterns and trends among aquatic and marine species, as well as land-based ones. Freshwater species are likely more threatened than ones on land, the new study shows, and the potential for species extinctions in the oceans has been severely underestimated and their protection neglected. While nearly 13 percent of Earth’s land area is now protected, only 2 percent of its ocean is. Traditional conservation measures, such as nature reserves, may fall short of conferring protection, especially for freshwater species.
“Most species live outside protected areas, so understanding how their environments are changing is a vital task,” Pimm said. “One of the most exciting opportunities made possible by new technology is that we can now combine existing databases such as the Red List with constantly updated maps of where species live, maps of areas that are protected, maps of land-use change and human impacts, and the species observations of amateurs. Rather than relying primarily on local snapshots of biodiversity, we can fashion a more detailed global perspective of Earth’s biodiversity, the threats to it and how to manage them.” “
The gap between what we know and don’t know about Earth’s biodiversity is still tremendous — but technology is going to play a major role in closing it and helping us conserve biodiversity more intelligently and efficiently,” said Lucas N. Joppa, a conservation scientist at Microsoft’s Computational Science Laboratory in Cambridge, U.K. “These new approaches will also be vital in evaluating progress toward international conservation goals such as the recently established Aichi targets of the Convention on Biological Diversity.”
CITATION: “The Biodiversity of Species and Their Rates of Extinction, Distribution, and Protection,” by Stuart L. Pimm, Clinton N. Jenkins, Robin Abell, Tom M. Brooks, John. L. Gittleman, Lucas N. Joppa, Peter. H. Raven, Callum. M. Roberts and Joe O. Sexton. Science, May 30, 2014. DOI: 10.1126/science.1246752.
.jpg)
.jpg)
.jpg)
.jpg)