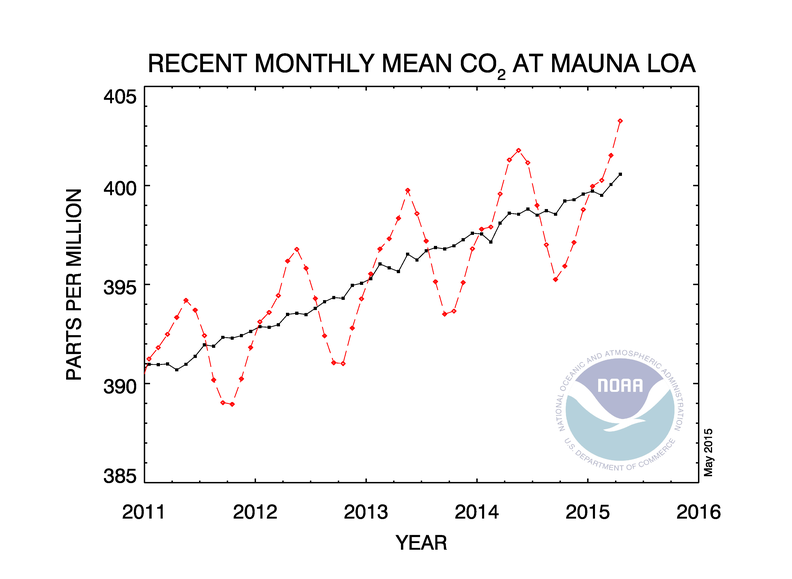
According to a NOAA press release dated May 6, 2015 and with the title above, global carbon dioxide concentrations have surpassed 400 parts per million for the first month since measurements began:
For the first time since we began tracking carbon dioxide in the global atmosphere, the monthly global average concentration of this greenhouse gas surpassed 400 parts per million in March 2015, according to NOAA’s latest results. “It was only a matter of time that we would average 400 parts per million globally,” said Pieter Tans, lead scientist of NOAA’s Global Greenhouse Gas Reference Network. “We first reported 400 ppm when all of our Arctic sites reached that value in the spring of 2012. In 2013 the record at NOAA’s Mauna Loa Observatory first crossed the 400 ppm threshold. Reaching 400 parts per million as a global average is a significant milestone.
“This marks the fact that humans burning fossil fuels have caused global carbon dioxide concentrations to rise more than 120 parts per million since pre-industrial times,” added Tans. “Half of that rise has occurred since 1980.”
The International Energy Agency reported on March 13 that the growth of global emissions from fossil fuel burning stalled in 2014, remaining at the same levels as 2013. Stabilizing the rate of emissions is not enough to avert climate change, however. NOAA data show that the average growth rate of carbon dioxide concentration in the atmosphere from 2012 to 2014 was 2.25 ppm per year, the highest ever recorded over three consecutive years.
NOAA works with partners around the world to make sustained measurements of atmospheric gases.These data are used in analyses that aid our understanding of climate change and provide information to help decision-makers address the challenges facing our planet.
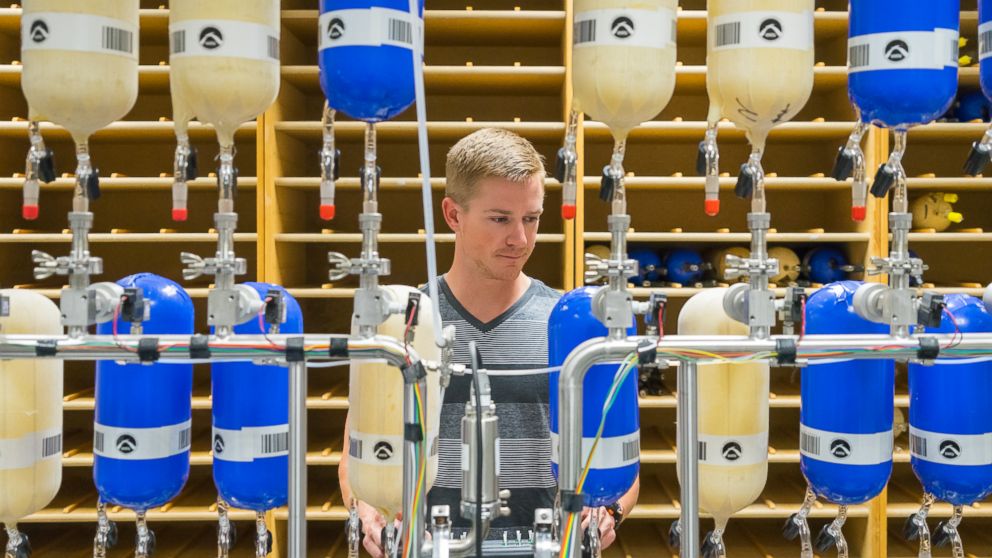
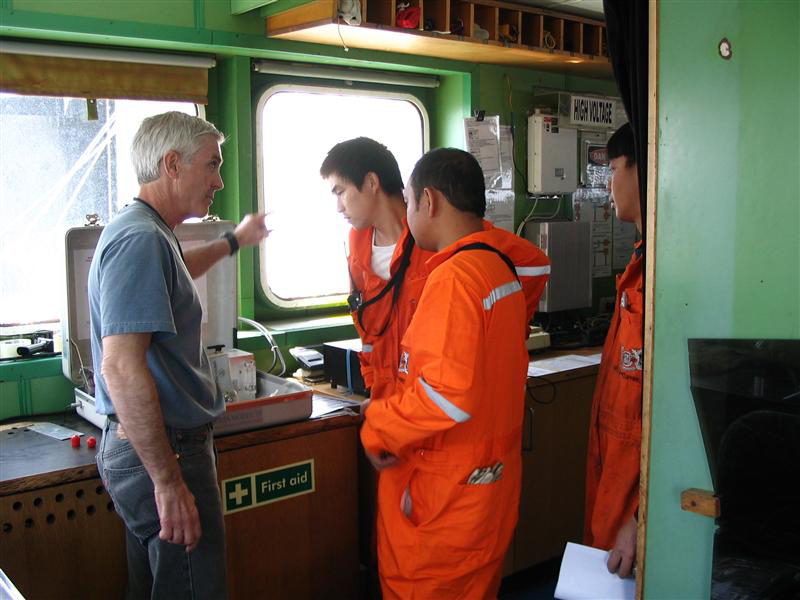
NOAA bases the global carbon dioxide concentration on air samples taken from 40 global sites. NOAA and partner scientists collect air samples in flasks while standing on cargo ship decks, on the shores of remote islands and at other locations around the world. It takes some time after each month’s end to compute this global average because samples are shipped from locations for analysis at NOAA’s Earth System Research Laboratory in Boulder, Colorado. “We choose to sample at these sites because the atmosphere itself serves to average out gas concentrations that are being affected by human and natural forces. At these remote sites we get a better global average,” said Ed Dlugokencky, the NOAA scientist who manages the global network.
Dlugokencky said he expects the global average will remain above 400 ppm through May, the time of year when global carbon dioxide concentrations peak due to natural cycles on top of the persistent rising greenhouse gases. Decaying plant matter and soil organisms give off carbon dioxide gas all year long, but the dormant period in plant growth allows the respiration of carbon dioxide to dominate during those months. Carbon dioxide levels drop back down as plants begin to bloom, using carbon dioxide for photosynthesis in late spring and summer.
James Butler, director of NOAA’s Global Monitoring Division, added that it would be difficult to reverse the increases of greenhouse gases which are driving increased atmospheric temperatures. “Elimination of about 80 percent of fossil fuel emissions would essentially stop the rise in carbon dioxide in the atmosphere, but concentrations of carbon dioxide would not start decreasing until even further reductions are made and then it would only do so slowly.”