If you want to inspire confidence, give plenty of statistics. It does not matter that they should be accurate, or even intelligible, as long as there is enough of them – Lewis Carroll
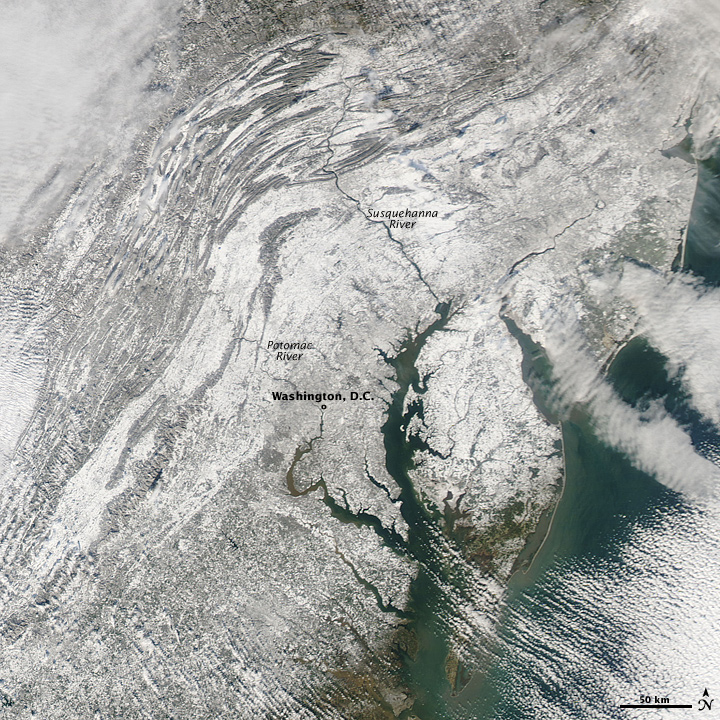
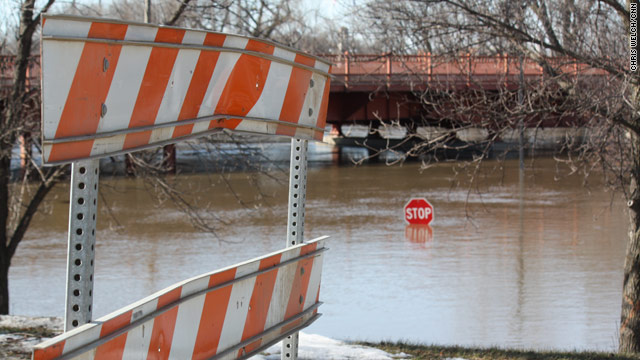
There are more clichés about the weather than about any other subject except, perhaps, men, women, and the relations between the two. Either way, weather extremes have been a major news topic this year. In January, Florida recorded its 10th coldest month ever, while Oregon and Washington had their 4th warmest January on record, with Seattle recording its warmest January since records began in 1891. The series of blizzards that enveloped the mid-Atlantic region of the U.S. during February, dubbed “Snowmageddon” and “Snowpocalypse” by the media, led to several deaths, paralyzed air and land traffic, and set several new records for snowfall amounts. In accordance with the cliché that March is supposed to come in like a lamb and go out like a lion, major flooding occurred along the Red River in North Dakota in late March, resulting in the second worst flooding in the state’s history, and, as of the end of March, 24 river gauges were reporting major flood levels across the Northern Plains and New England according to www.noaawatch.gov. Meanwhile, drought has afflicted 60 percent of Hawaii’s land cover, with the northern portion of the Big Island moving into exceptional drought—the highest category as defined by the U.S. Drought Monitor (USDM) —at the beginning of March for the first time since the inception of the USDM in 1999 (source).
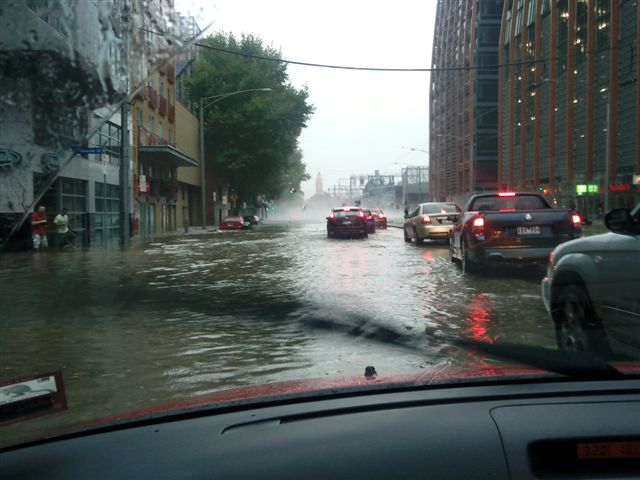
Climatic extremes know no boundaries. NASA’s Goddard Institute for Space Studies (GISS) released data on 17 February 2010 showing that surface temperatures in the Southern Hemisphere in January 2010 were 0.62 degrees Centigrade above the 1951-1980 mean, far exceeding the 0.47°C anomaly recorded in January 2007 — which until now was the warmest January on record. The data covers land-surface air temperatures and sea-surface water temperatures combined. According to NOAA’s State of the Climate, Global Hazards, January 2010: “While much of the Northern Hemisphere was experiencing anomalously cool temperatures, parts of Australia had record warmth. On January 11th, the daily minimum temperature at Melbourne dropped to only 93°F (34°C), marking the warmest night in the city since 1902.” February 2010 was the third warmest February on record for Western Australia (85.2°F [29.6°C] (Source: Bureau of Meteorology), and during the weekend of 6 and 7 March, Melbourne received 61 mm (2.4 in) of rainfall, more than the entire March average of 50 mm (2.0 in). Extensive storms and flash flooding also affected Melbourne only weeks beforehand on 11 February 2010 and on 31 December 2009, while fellow capital city Perth suffered a similar fate on 22 March 2010. Another flash flood affected the Melbourne metropolitan area three weeks later on the morning of March 29 (Wikipedia).
According to the same source, “the rainfall pattern has changed in Perth and Southwest Western Australia since the mid-1970s. A significant reduction in winter rainfall has been observed with a greater number of extreme rainfall events in the summer months, such as slow-moving storms on 8 February 1992 which brought 121 mm (4.76 in) of rain, and a hail and thunder storm on 22 March 2010, which brought 40.2 mm (1.58 in) and caused significant damage in the metropolitan area.” Other notable weather extremes to date this year include the U.K. experiencing its coldest January since 1987; Seoul, South Korea having the greatest amount of snowfall since records began in 1937; extreme drought, the most dangerous category as listed by the Beijing Climate Center, covering portions of Guizhou, China; Beijing itself recording the lowest minimum temperature in the first ten days of January since 1971; Canada experiencing its driest December-February period since national records began in 1948; and on and on.
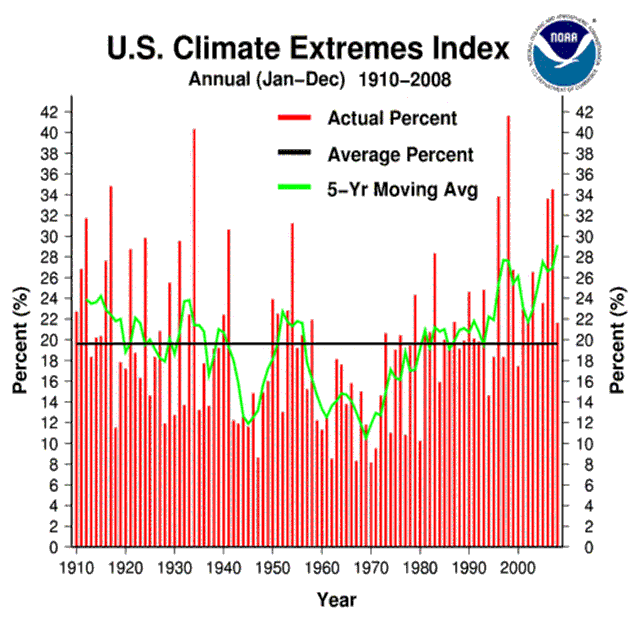
While it is meaningless to draw conclusions about the climate from any single weather event or observation, climate is the average of weather over a long period of time. According to Thomas Karl, director of the U.S. National Climatic Data Center, “how climate change will be felt by you and impact your neighbors is probably going to be through extreme weather and climate events…Extreme events are a manifestation of climate change, and probably one of the more significant aspects of global climate change” (source). Things are warming up, and the climes, they are a-changin’, to paraphrase Dylan.
I’ve come loaded with statistics, for I’ve noticed that a man can’t prove anything without statistics – Mark Twain
Statistics are like bikinis. What they reveal is suggestive, but what they conceal is vital – Aaron Levenstein
Article by Bill Norrington