The following is a public news release by the Potsdam Institute for Climate Impact Research dated 7/1/13 and with the title above:
In order to extend forecasting from six months to one year or even more, scientists have now proposed a novel approach based on advanced connectivity analysis applied to the climate system. The scheme builds on high-quality data of air temperatures and clearly outperforms existing methods. The study will be published this week in the Proceedings of the National Academy of Sciences.
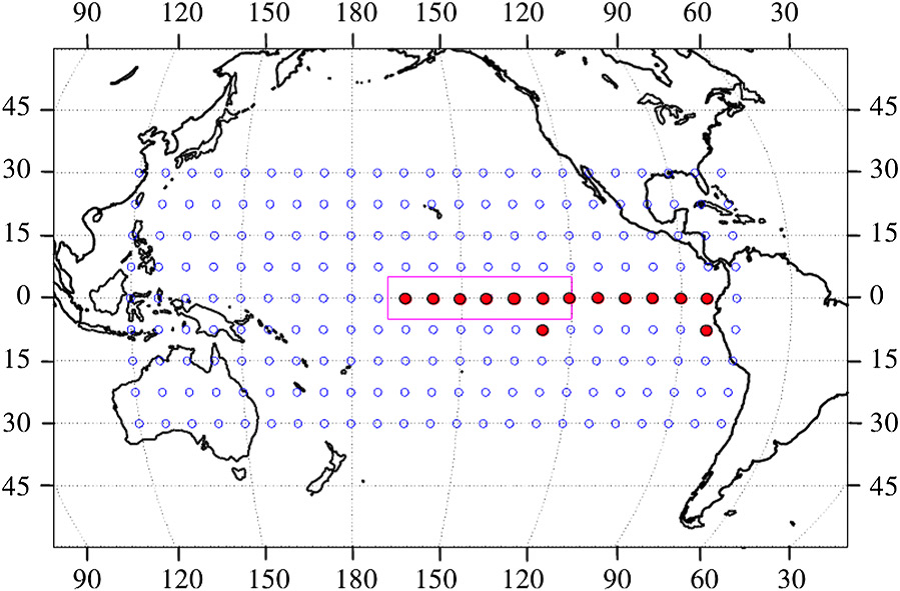
“Enhancing the preparedness of people in the affected regions by providing more early-warning time is key to avoiding some of the worst effects of El Niño,” says Hans Joachim Schellnhuber, director of the Potsdam Institute for Climate Impact Research and co-author of the study by Josef Ludescher et al (Justus-Liebig Universität Giessen). The new approach employs network analysis which is a cutting-edge methodology at the crossroads of physics and mathematics. Data from more than 200 measurement points in the Pacific, available from the 1950s on, were crucial for studying the interactions between distant sites that cooperate in bringing about the warming.
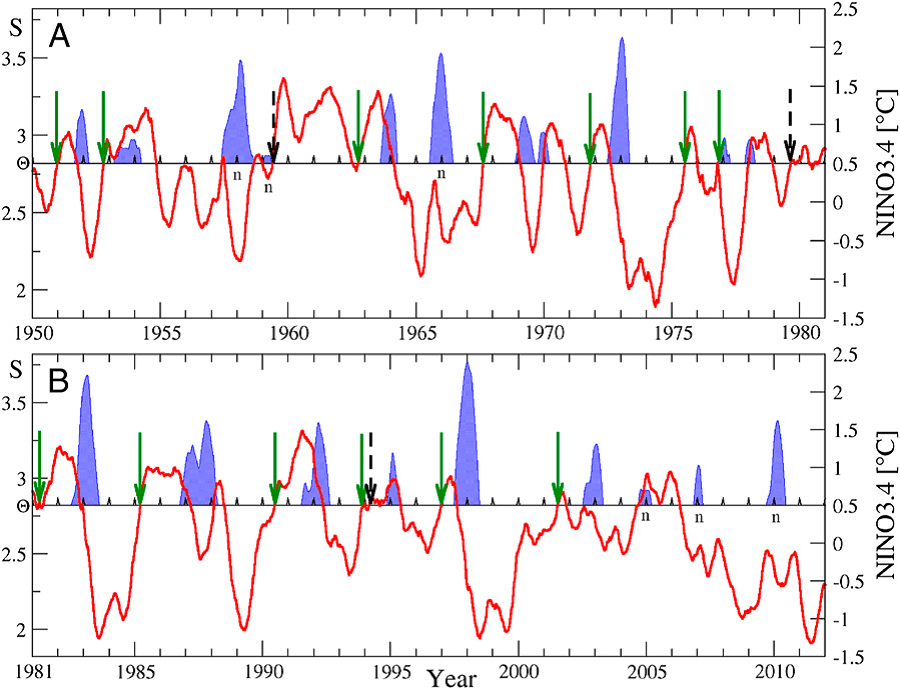
According to Schellnhuber a new algorithm was developed and tested which does not only extend the forecasting time but also enhances the reliability. In fact, the novel method correctly predicted the absence of an El Niño-event in the last year. This forecast was made in 2011 already, whereas conventional approaches kept on predicting a significant warming far into 2012.
El Niño is part of a more general oscillation of the Pacific ocean-atmosphere system called ENSO, which also embraces anomalous cold episodes dubbed La Niña which can inflict severe damages as well. The present study focuses on the warming events only. However, an El Niño-year is followed by a La Niña-year, as a rough rule.
“It is still unclear to which extent global warming caused by humankind’s emissions of greenhouse gases will influence the ENSO pattern,” says Schellnhuber. “Yet the latter is often counted among the so-called tipping elements in the Earth system, meaning that at some level of climate change it might experience a relatively abrupt transformation.” Certain data from the Earth’s past suggest that higher mean global temperatures could increase the amplitude of the oscillation, so correct forecasting would become even more important.
Article: Ludescher, J., Gozolchiani, A., Bogachev, M.I., Bunde, A., Havlin, S., Schellnhuber, H.J. (2013): Improved El Niño forecasting by cooperativity detection. Proceedings of the National Academy of Sciences (early online edition) [DOI:10.1073/pnas.1309353110].