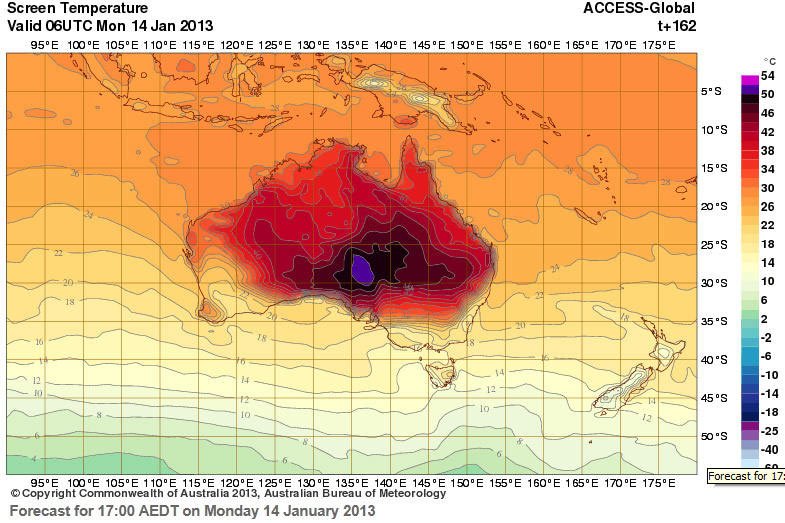
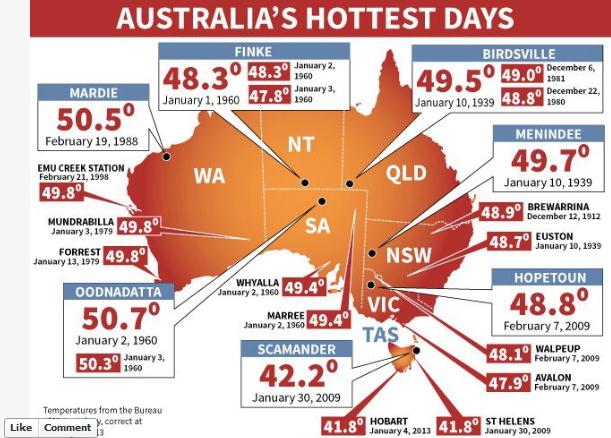
Monday, January 7, was the hottest day on record for Australia – the temperature peaked at an average of 40.33 C. The current heat record is held by Oodnadatta, South Australia, which recorded 50.7 C, on January 2, 1960. Australia’s Bureau of Meteorology’s interactive weather forecasting chart has now added new colors – deep purple and pink – to extend its previous temperature range to 54 degrees. “While recent days have seen Australian temperature maps displaying maximums ranging from 40 degrees to 48 degrees – depicted in the colour scheme as burnt orange to black – both Sunday and Monday are now showing regions likely to hit 50 degrees or more, coloured purple. Aaron Coutts-Smith, the bureau’s NSW head of climate monitoring, though, cautioned that the 50-degree reading is the result of just one of the bureau’s models. ‘The indications are, from the South Australian office, that we are not looking at getting anywhere near that (50 degree level).’ Still, large parts of central Australia have limited monitoring, so the 50.7 degree record may be broken. ‘The air mass over the inland is still heating up – it hasn’t peaked,’ another spokesman stated” (source).
According to a special climate statement issued by Australia’s National Meteorological Service on January 8, “Large parts of central and southern Australia are currently under the influence of a persistent and widespread heatwave event…The last four months of 2012 were abnormally hot across Australia, and particularly so for maximum (day-time) temperatures. For September to December (i.e., the last four months of 2012), the average Australian maximum temperature was the highest on record with a national anomaly of +1.61 °C, slightly ahead of the previous record of 1.60 °C set in 2002 (national records go back to 1910)…The start of the current heatwave event traces back to late December 2012, and all states and territories have seen unusually hot temperatures with many site records approached or exceeded across southern and central Australia…A particular feature of this heatwave event has been the exceptional spatial extent of high temperatures. Australia set a new record for the highest national area-average temperature, recording 40.33 °C and surpassing the previous record set on 21 December 1972 (40.17 °C). To date (data up to the 7 January 2013), the national area-average for each of the first 7 days of 2013 has been in the top 20 hottest days on record, with 6 January the fifth hottest on record and the first time 6 consecutive days over 39 °C has ever been recorded for Australia.”
Editor’s note: Many thanks to grad student Tim Niblett for suggesting this material.