“Geography researchers use real data from the department’s climate monitoring stations to teach students how to explore the environment.” In a February 13 Science and Technology article in The Current, with the title above, Julie Cohen goes on to state:
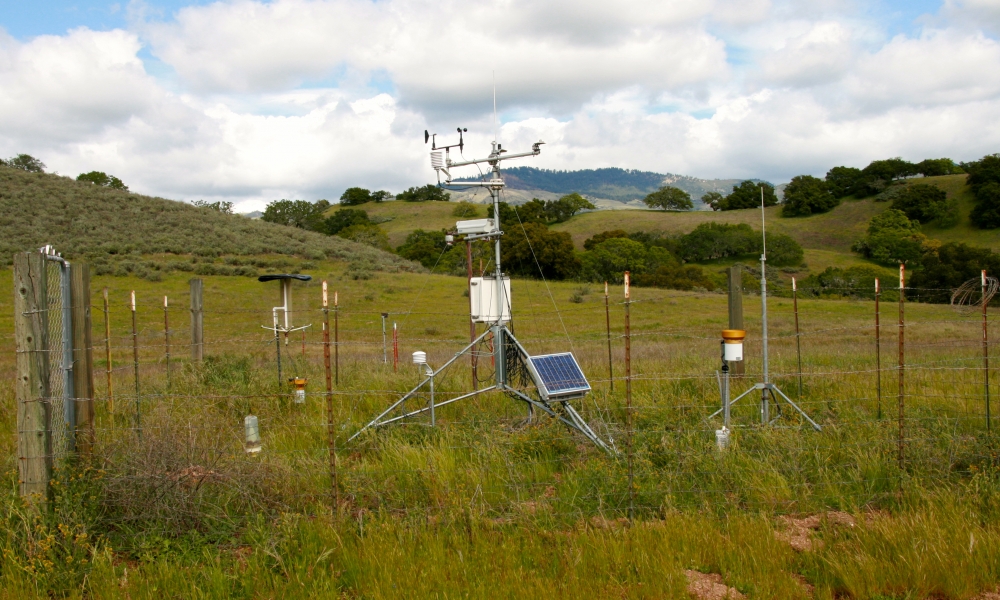
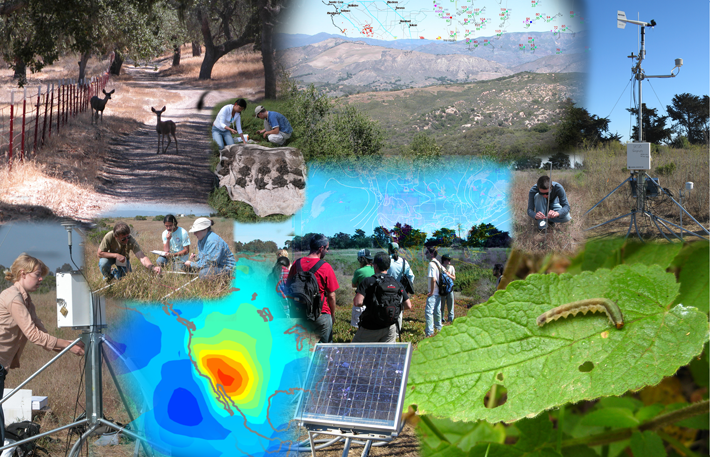
Climate monitoring stations take climate change beyond the anecdotal. These remote monitoring sites, which collect measurements on such data as temperature, wind speed, precipitation, fog, and soil moisture, offer more solid evidence of climate change. To scientists in UC Santa Barbara’s geography department, the climate monitoring stations are essential to professors and students alike. They are used not only for teaching classes but also for a host of research projects. For example, the stations contribute to the Innovative Datasets for Environmental Analysis by Students (IDEAS) website, a repository for real-time and archived data from the five department stations: Coal Oil Point; Painted Cave; two on the Sedgwick Reserve (Airstrip and Lisque Creek); and Mission Canyon, a private station whose data is hosted by IDEAS.
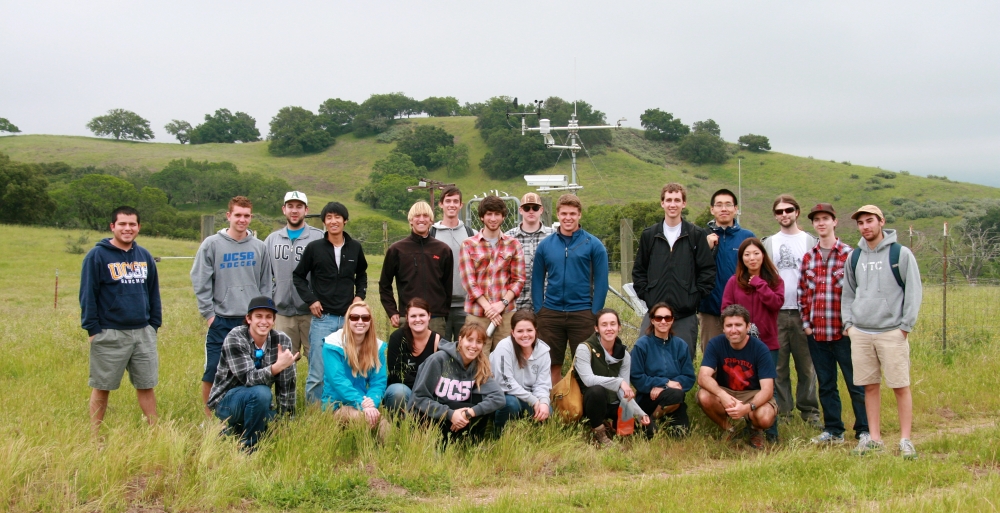
“I’m very proud of our site,” said department chair Dar Roberts, who teaches one of several undergraduate classes that use the IDEAS website. “It’s an educational site designed for easy understanding. Students use it to learn how the physical environment operates by contrasting very different settings. The idea is that the students do projects and link changes in the environment to plant responses.”
Because the stations are located in different habitats, students can contrast data from, say, a coastal location (Coal Oil Point) versus an interior site (Airstrip). “I collect leaf samples from the Santa Barbara area and Sedgwick Reserve relatively close to some of the monitoring stations,” said Susan Meerdink, a graduate student and teaching assistant in UCSB’s Department of Geography. “When looking at the foliar chemistry and biophysical properties of the leaves, I find it is useful to know what the environment was doing at the time of collection,” she continued. “For example, if the water content in the leaves is low it might be explained by some environmental properties, such as soil water content, measured by the stations. Having the IDEAS dataset can be useful in explaining deviations in my leaf dataset especially when analyzing seasonal changes.”
“I like using real data from the UCSB climate monitoring systems because I can see how data values relate to the real world with my own eyes,” said Brittany Gale, an undergraduate student who took Robert’s Measuring the Environment class. “The data becomes more relatable and meaningful.”
According to Roberts, a key component for studying geographical phenomenon remotely is the webcam, although he says the equipment is difficult to keep online. But he believes their importance outweighs their tricky maintenance. “Webcams are becoming major research tools and there’s a huge amount that can be done with them, he said. “We contribute our data to the Phenocam site nationally. This is really going to be the tool that allows us to quantify phenology, because there are a lot of plant-derived metrics of phenology — the study of how periodic plant and animal lifecycles are influenced by seasonal and interannual variations in climate — that can be obtained only via webcam.
“For instance, it’s difficult to know whether the plants have leaves or not unless you’re actually taking an image of the plant canopies,” Roberts added. “And if you want to know if plants are dropping their leaves earlier every year, again it takes a webcam or something like litter traps to determine that. I think webcams are more interesting for students because they are more visual.”
Now students also have access to data from 26 climate monitoring stations in the http://nrs.ucop.edu/ UC Natural Reserve System (NRS), including four overseen by UCSB: Santa Cruz Island Reserve, Kenneth S. Norris Rancho Marino Reserve, Sierra Nevada Aquatic Research Laboratory and Sedgwick Reserve. This newly completed statewide network delivers slightly different data than the climate monitoring stations run by UCSB’s Department of Geography, but according to Roberts, it offers increased diversity and more variability of climate.
“The consistency of data across the NRS is important,” Roberts said. “From a teaching point of view, utilizing these data could make for a very interesting class. Imagine being able to ask questions about the entire state. The NRS climate monitoring network could engender a powerful teaching model. And because these are UC reserves, you could even design field trips or a summer course built around visiting these sites. Students could do standard quantitative ecological measures at each site, then compare sites and start asking questions about the differences between them.”
While the geography department’s five sites offer some wonderful contrasts, adding in NRS sites would give students more opportunities to contrast vastly different habitats. But even with only seven years of data from the departments sites — NRS sites only go back about three years — Roberts said he and his students have made some fascinating observations. “The species we saw at the Airstrip in Sedgwick were completely different than two years ago and a lot of it was because of the really bizarre rainfall,” he said. “We got no rain in January and it was really warm and so it was a completely different species mix. Oftentimes, the species you see are going to change from one year to the next in some of these grassland sites depending on the rainfall and temperature.”
According to Roberts, learning from real data is incredibly important, as is having students do active research projects. “We’re being flooded with vast amounts of data from satellites, from weather stations, you name it, and it requires a different way of formulating research questions,” he said. Such questions teach lessons in climate change that can be learned only firsthand. “Real data made the learning process much more tangible,” said undergraduate Ryan Fallgatter, who has taken two geography classes that have used IDEAS data. “Because the data was coming from right here, it was much less abstract and much more meaningful. We had actual numbers and could do a real analysis of what we felt but couldn’t quite articulate.” The IDEAS website was funded by the National Science Foundation’s Course, Curriculum and Laboratory Improvement program and by UCSB’s Department of Instructional Development.


