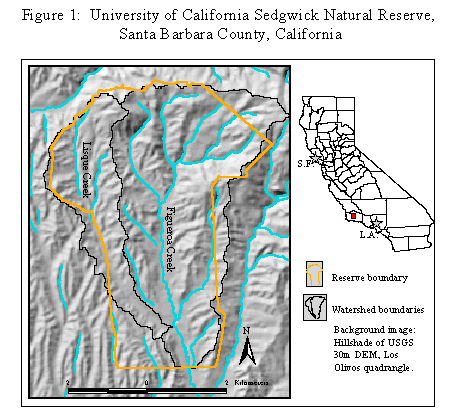
These datasets can be used in a variety of ways to display sample locations, examples of topographic relief, or orientation of a field site. Here's one example of a study site location figure:
Digital Terrain Analysis
Terrain analysis can include any type of calculation from digital representations
of the landsurface. This can range from simple overlay analysis, where
the intersection of layers can provide useful information. For example,
if one wanted to define a sampling plan based on topographic characteristics
and areal extent, one could select all areas larger than 300m2
with slope less than 5%, or any combination of terrain attributes which
are important for the phenomena being studied. These grids are also useful
for a variety of map algebra calculations and creation of environmental
models dealing with the occurrence of natural phenomena which are dependent
on topography, hydrology, or insolation. Examples:
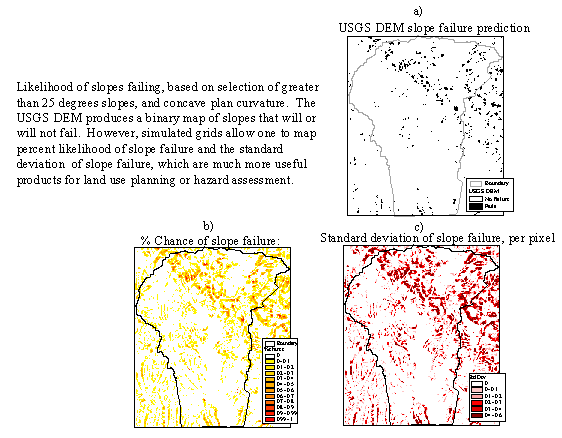
BE AWARE OF WHAT ERRORS IN THE USGS DEM CAN DO TO YOUR RESULTS
See this animation
of 50 simulated error surfaces of the area.
· prediction of the location of oaks or chaparral based on aspect and slope characteristics
· prediction of landslides based on slope and concavity (plan curvature):